
RETECHNOLOGY PREMIUM MARKETPLACE RELATED PRODUCTS | WEBINARS | SPECIAL OFFERS


You are viewing our site as a Broker, Switch Your View:
Agent | Broker Reset Filters to Default Back to ListA Simple Yet Effective Strategy for Generating a Market Activity Report for Your Farm Area
March 19 2018
 Did you know the RPR Market Activity Report can be customized to match any geographic area? That's right! And it's easy too.
This article will explore the simple steps needed to slice and dice your Market Activity Report to perfectly represent your needs. Hint: it's all accomplished using the RPR map. From there, you'll have a variety of ways to isolate your custom area using the RPR map tools.
Here are the options we'll explore:
Map Tools
Draw a shape
- Box
- Radius
- Polygon
Map Pin
- Drive time
- Distance
Custom Area
- Create a new custom search
- Access previously saved searches
- Edit custom searches
Show Geographies
- MCDs/Townships
- Cities
- Census Tracts
- Zip Codes
- Macro Neighborhoods
- Intermediate Neighborhoods
- Micro Neighborhoods
- Census Block Groups
- School Districts
- 9th-12th Grade
- 6th-8th Grade
- K-5th Grade
Getting started from the RPR homepage
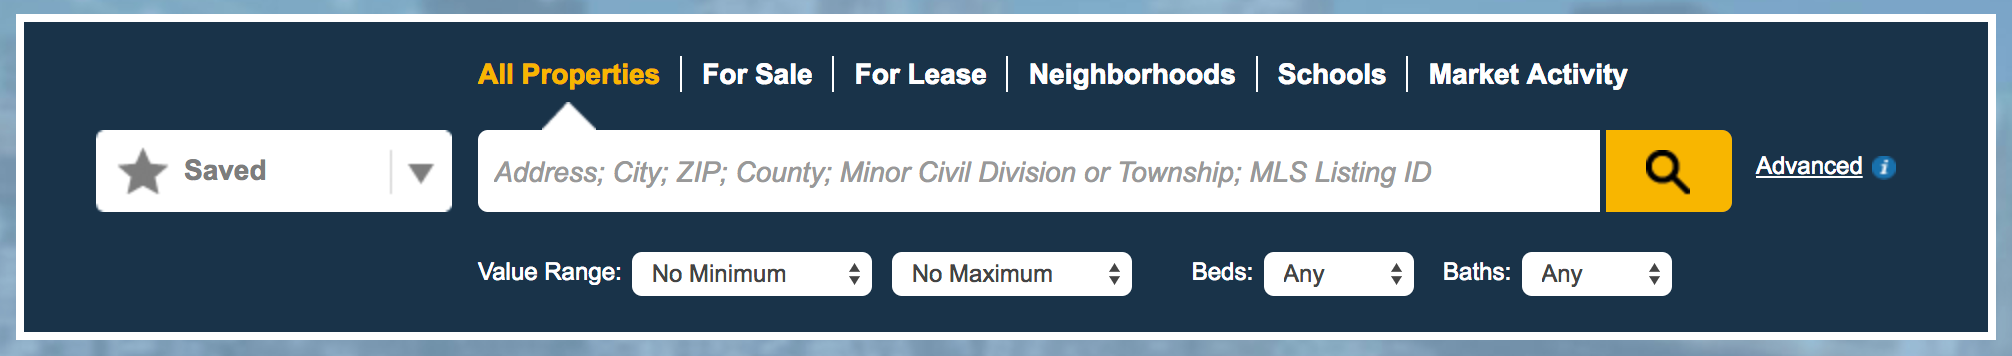
We'll use the RPR map to zero in on the perfect geography, but first we need to access the map. For that, we need to perform a search. I recommend using the All Properties search type. Enter the zip code for your farm area and then choose Search.
You'll then arrive at the map. If you arrived at List View, it's easy to switch by selecting Map View at the top of the screen.
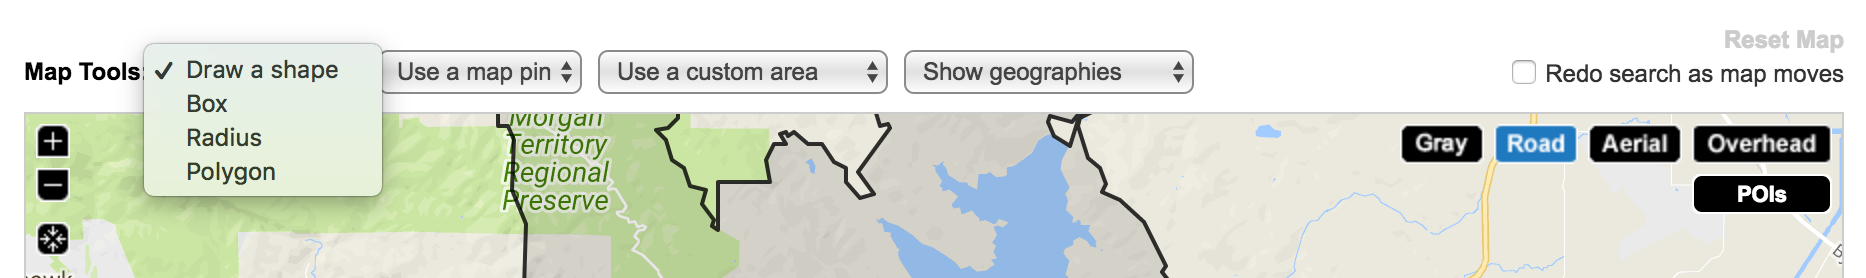
Draw a shape
Before choosing a shape to draw on the map, use the controls to zoom and center the map over the neighborhood you will be isolating. Then use the Draw a Shape dropdown and select your shape: Box, Radius or Polygon. Now use the mouse to add the first point on the map. Then, if you've selected Box or Radius, simply drag your mouse across the map and your custom geography will display. If you've selected Polygon, each click on the map will add a new point. To finish the custom polygon, add new points until you connect the last point. A menu will display highlighting the custom area size and links to Search In the Area, Edit or Save. If saved, that shape will be available on future sessions from the Custom Area dropdown.
To create your Market Activity Report, choose Search In the Area from the menu. Once the results are displayed, choose the blue Create a Report button. You will arrive at the reports page and the custom geography will be noted. Choose Market Activity Report, customize as needed, and select Run Report.
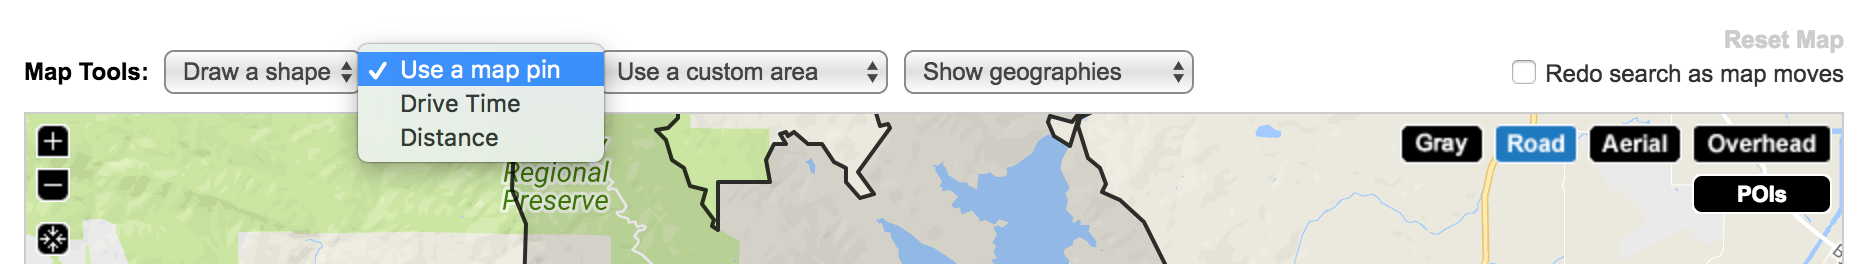
Map pin with distance or drive time
RPR's Distance and Drive Time search tools are terrific for identifying a geography based on travel times. Choose the search option: Distance or Drive Time. Then use the mouse to drop a pin at the center point you'll be searching. A menu will display. If you've selected Distance, the menu will prompt you to pick the ideal distance. Whereas Drive Time will display a few options, beginning with how the travel time is measured: car or walking. Then include time of the day, day of the week and length of journey.
To create the Market Activity Report, choose Search In the Area from the menu. Once the results are displayed, choose the blue Create a Report button. You will arrive at the reports page and the custom geography will be noted. Choose Market Activity Report, customize as needed and then Run Report.
Custom areas
Anytime you've saved a custom geography, it can be accessed from the Use a Custom Area dropdown. You can also create a new custom area from this menu, or even customize the search area previously saved by choosing Edit this List.
Show geographies
The Show Geographies dropdown is dynamic, changing according to map zoom level. For example, if you zoom way in, you'll only see options for census block groups and minor neighborhoods, but as you zoom out more options appear. The list can include geographies such as census tracts and block groups, townships, cities, Zip codes, neighborhoods, and school attendance zones. As you select a geography from the dropdown, the map will display shapes representing the geographies across your map. If you have difficulty seeing the shapes, trying changing the map from Road or Aerial to Gray.

Now, create your Market Activity Report. Choose the area by selecting one or more of the geographic shapes displayed. Each area you select will turn purple. When you're ready to create the report, choose the text link Create Market Activity Report displayed near the top of the map. From the Reports page, choose Market Activity Report and customize as needed.
Putting it all together
Taking the time to learn how to customize the RPR Market Activity Report for each audience means you'll have a more relevant and targeted marketing piece.
To easily pull up your report later, make sure to save the custom area. Also, consider using the Rerun This Report option to quickly regenerate the report within 30-days.
How will you utilizing a customized RPR Market Activity Report in your area?
Join the RPR Connect Facebook Group for more RPR market-level strategies, tips and tricks!
To view the original article, visit the RPR blog.