
RETECHNOLOGY PREMIUM MARKETPLACE RELATED PRODUCTS | WEBINARS | SPECIAL OFFERS


You are viewing our site as an Agent, Switch Your View:
Agent | Broker Reset Filters to Default Back to ListShow Demand for Any Neighborhood with the RPR Market Activity Report
August 24 2017
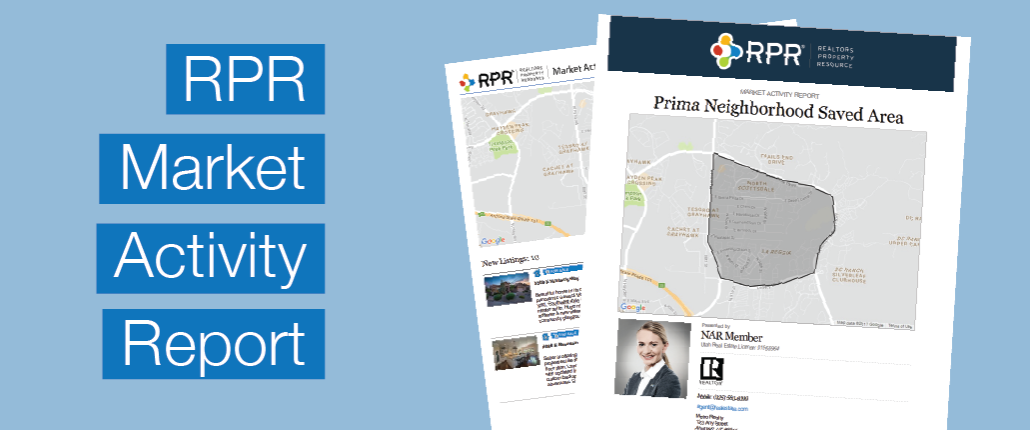
When your clients or prospects are interested in tracking a neighborhood's activity, the RPR Market Activity report is an ideal option. First, it's flexible and can be generated on any geography, even areas drawn using the RPR map. And the report itself includes changes in a local real estate market based on listing information and MLS data. The Market Activity report can include active, pending, sold, expired, distressed, new for lease, and recently leased properties, as well as recent price changes and upcoming open houses for a period of up to six months.
Rather than simply talk about it, let's walk through the process of creating a Market Activity report for a specific neighborhood we draw. For this example, we are interested in showcasing New, Pending, and Recently Sold Listings, as well as Price Changes. We will only include single family residences, and will include the previous three months of activity.
Market Activity How-To
- Visit RPR at narrpr.com
- From the search box, select Market Activity
- Type the area name: City, ZIP or Neighborhood name.
- Choose Show: Changes in the Last 3 Months
- Select Advanced
- Now deselect all property types except Single Family Residence
- Choose Search
Drawing Custom Area Using Maps
- Confirm that you have the Map View open
- Using the map navigation, zoom and pan to clearly show the subject neighborhood
- Above the map in Map Tool, select the Polygon tool
- Now click on the map to drop points for your shape. When you connect the last point, a prompt to save or search appears
TIP: If you'll be running this report regularly, save the shape to recall later. - Choose Search
- Now choose Create a Report
Generating the Market Activity Report
- Select Market Activity Report
- Select More Details
- Confirm the report elements
- Personalize your report
- Choose a delivery method: Download or Email
Still have questions? Watch this quick video.
To view the original article, visit the RPR blog.