
RETECHNOLOGY PREMIUM MARKETPLACE RELATED PRODUCTS | WEBINARS | SPECIAL OFFERS


You are viewing our site as a Broker, Switch Your View:
Agent | Broker Reset Filters to Default Back to ListRPR Mobile Welcomes Open House Data
March 30 2017

Planning this week's broker caravan or open house tour just got a whole lot easier, thanks to a significant upgrade to the RPR app.
A new "Open House" feature joins the ranks of the app's other notable home screen displays, such as the number of For Lease, Distressed, Recently Sold, New Listings, and For Sale properties. Within the Open House search, a map appears with a yellow box around the property pin. From there, users can:
- View a count of open houses in your market on the home screen.
- See open house information highlighted with properties in your search results.
- View the next open house date and time on the thumbnail of the property.
- Set your search filters to show only properties with open houses.
- Use advanced search filtering to search by the date of any open houses in your area.
In Other Mobile News
RPR account holders can now turn on Traffic Count layers without losing visibility of their search results. Property pins will appear behind the traffic pins when applicable and will be grayed out.
Website Updates
ESRI data reaches major milestone––now, over one billion data points
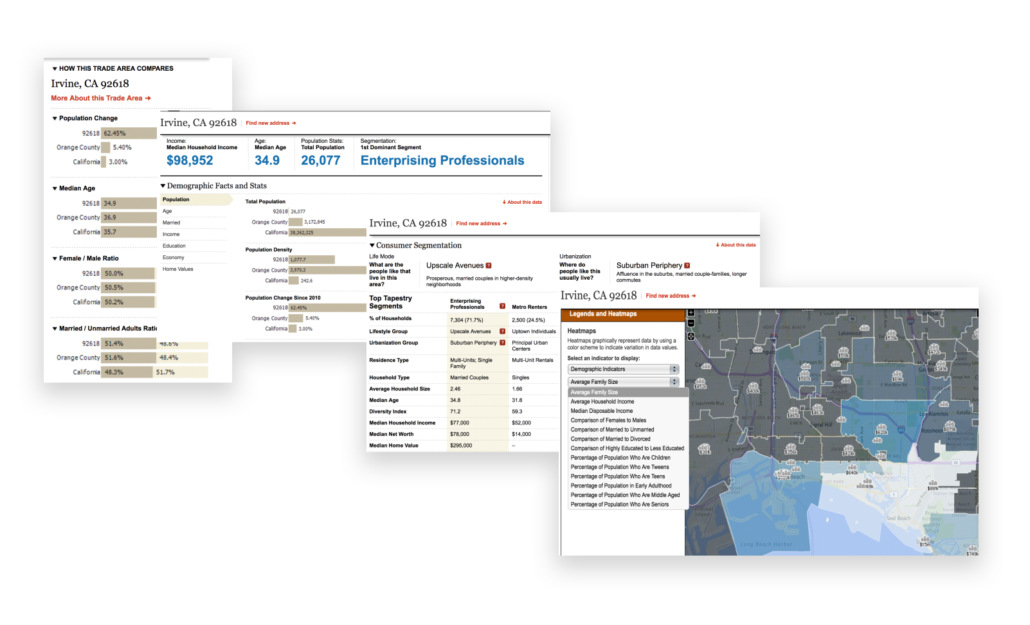
ESRI, a forerunner in consumer segmentation for the commercial real estate industry, helps us understand customer lifestyle choices, buying habits, and how they spend their free time. Now, ESRI data has been refreshed within RPR to include up-to-date housing, economic, spending and demographic information. This data is used in RPR's Neighborhood Reports, Residential and Commercial Trade Area Reports, and thematic maps.
Plus, you can see trends and track specific household data using the data and thematic overlays RPR provides. The following illustration shows just how in depth you can engage with RPR and ZIPs using our built-in overlays and thematic maps.
If you live in one of these metro areas, you'll find improved accuracy in RPR's neighborhood data:
- Austin, TX
- Denver, CO
- Jacksonville, FL
- Newark, NJ
- Madison, WI
- Memphis, TN
- Miami, FL
- Milwaukee, WI
- Omaha, NE
- Palm Springs, CA
- Phoenix, AZ
- Portland, OR
- Raleigh-Durham, NC
- San Diego, CA
- Spokane, WA
And, within these areas, improved accuracy in RPR’s school boundary data:
- Alpine SD, UT
- Anne Arundel County PS, MD
- Baltimore City SD, MD
- Brevard County SD, FL
- Charlotte Mecklenburg Schools, NC
- Chesterfield County PS, VA
- Clark County, NV
- Corona-Norco Unified, CA
- Dade County, FL
- Dallas Independent SD, TX
- Denver PS, CO
- Douglas County SD, NO. RE1, CO
- Duval, FL
- El Paso ISD, TX
- Elk Grove Unified, CA
- Fairfax County PS, VA
- Fort Worth ISD, TX
- Guilford County, SC
- Gwinnett County, GA
- Hillsborough County SD, FL
- Jordan SD, UT
- Katy ISD, TX
- Knox County SD, TN
- Lee County SD, FL
- Loudoun County PS, VA
- North East ISD, TX
- New York City PSD, NY
- Orange, FL
- Palm Beach SD, FL
- Plano ISD, TX
- Polk County SD, FL
- Prince WIlliam County PS, VA
- Recovery SD, East Baton Rouge, LA (New)
- San Diego Unified SD, CA
- San Francisco Unified, CA
- VA Beach City PS, VA
- Volusia County SD, FL
Home improvement data gets a refresh as well
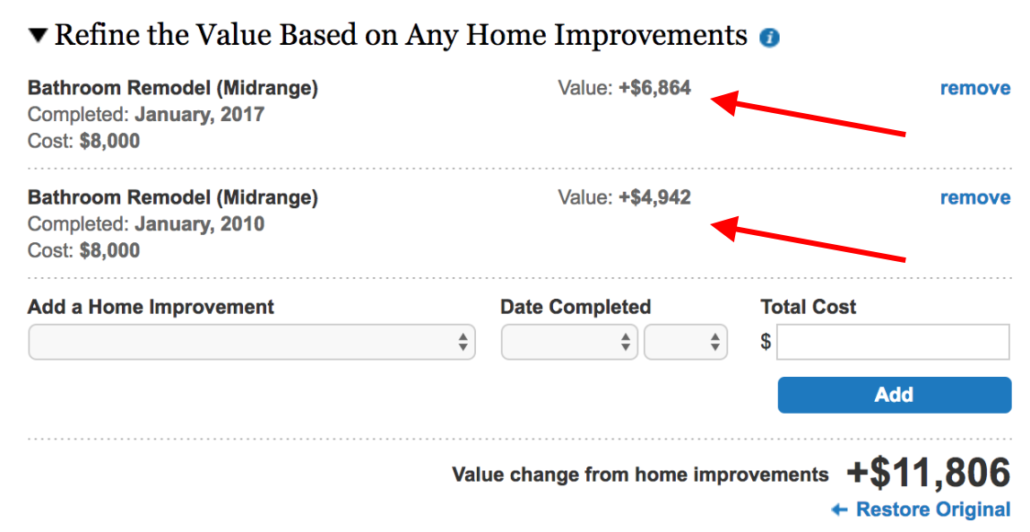
Hanley Wood––an aggregator of residential and commercial construction data, as well as publisher of Remodeling magazine––has provided data updates to reflect the latest national home improvement and depreciation values. The data is used when refining a property estimate in the Refined Value tab on RPR's Property Details page. Hanley Wood has also introduced a new home improvement option, Attic Insulation (midrange).
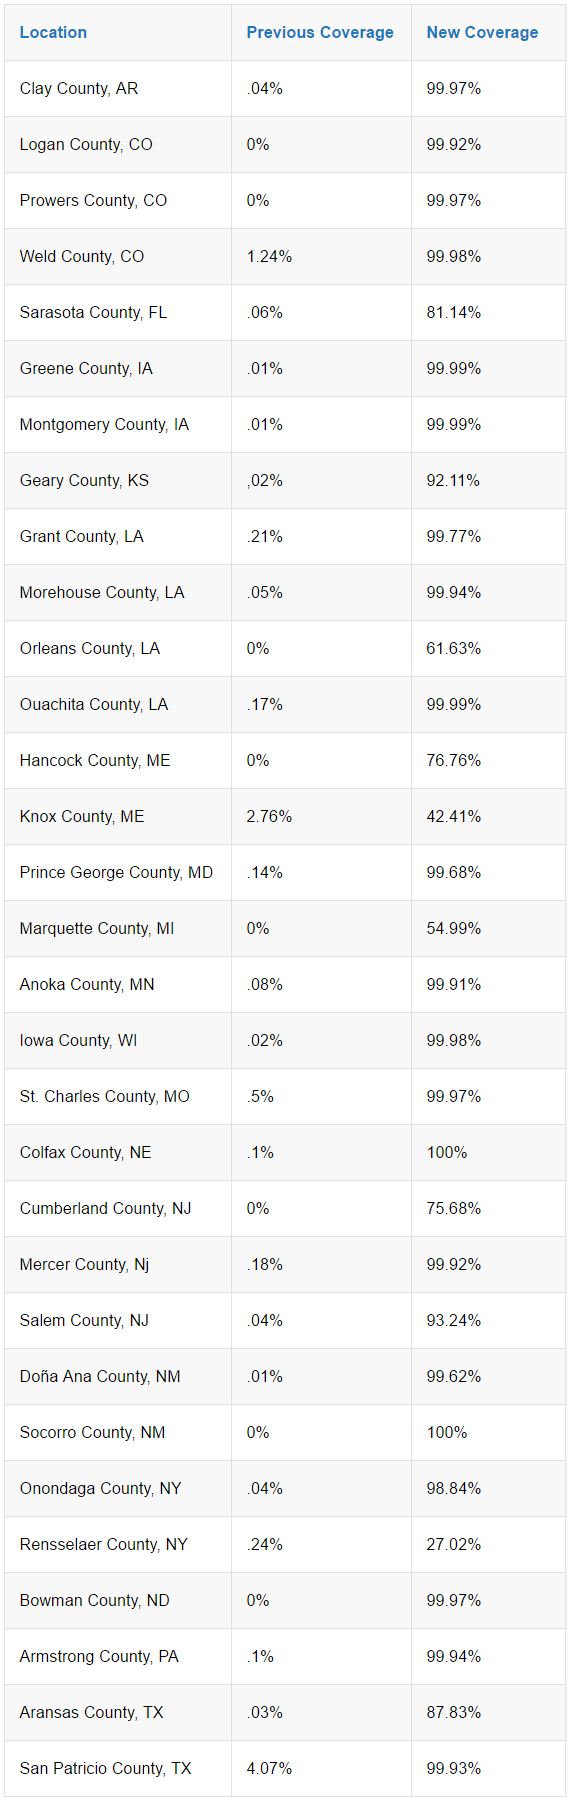
FEMA flood map refresh –– zero to 99 for some counties
The 2016 FEMA Flood Map refresh includes new and increased coverage in the following counties:
Other Key Updates
Population Change Indicator Updated
(Source: Policy Map)
Neighborhood population facts now reflect the most current data available (2010-Present). Commercial users will also see new population growth rate options (2010-2016 and 2016-2021) when running market analysis searches or creating reports.
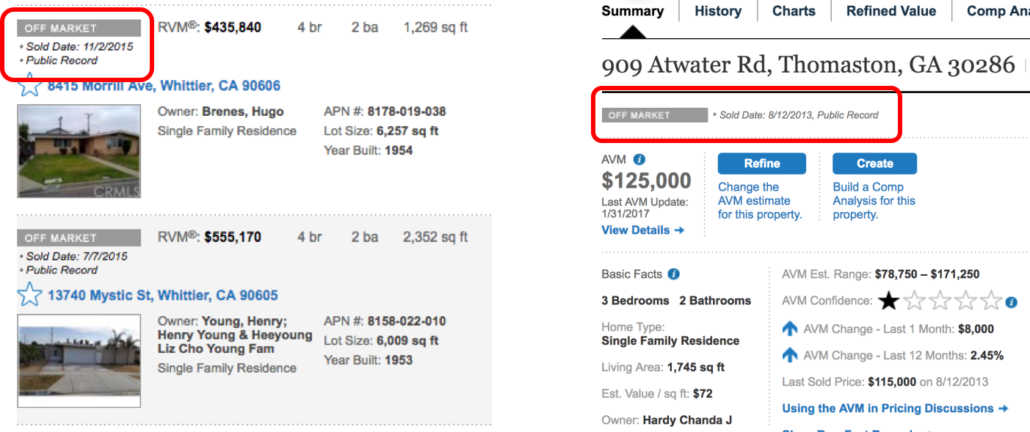
Sold Date and Source on Off-Market Properties
RPR search results and property details will now feature the sold date and data source (MLS or public records) next to the status flag on off-market properties so users can easily identify how recently a property was sold.
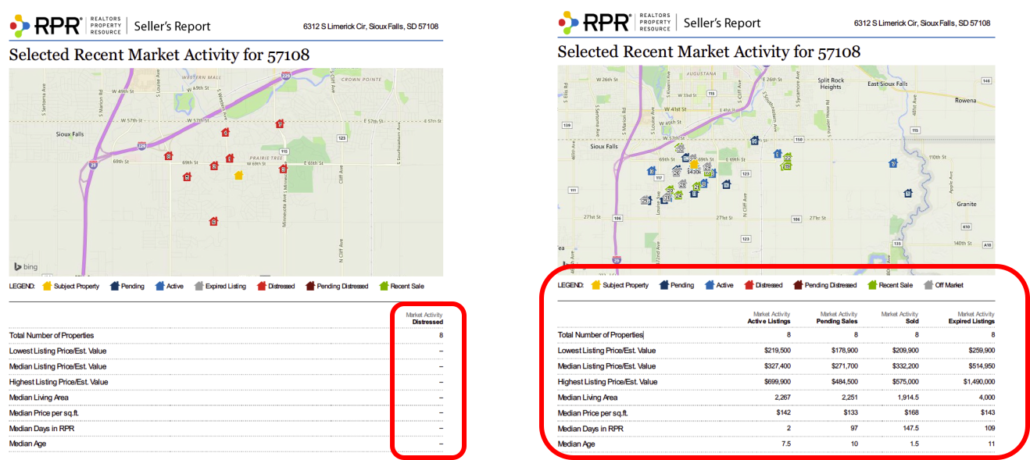
Seller's Report Distinguishes Property Type From Listing Data
RPR's Seller's Report now displays a listing's property type from MLS data, versus public records. The improvement will maximize the number of listings returned on RPR reports and aid with decision analysis when pricing a property for consumers.
To view the original post, visit the RPR blog.