
RETECHNOLOGY PREMIUM MARKETPLACE RELATED PRODUCTS | WEBINARS | SPECIAL OFFERS


You are viewing our site as an Agent, Switch Your View:
Agent | Broker Reset Filters to Default Back to ListU.S. Home-Seller Profits Continue Rising as Home Values Hit New Highs in Third Quarter
October 25 2023
Profit Margins on Typical Home Sales Nationwide Increase to Almost 60 Percent; Returns Rise for Second Straight Quarter as Median U.S. Home Price Hits Another Record; Seller Profits Still Down from Year Ago Following Earlier Slide
IRVINE, Calif. – Oct. 19, 2023 — ATTOM, a leading curator of land, property and real estate data, today released its third-quarter 2023 U.S. Home Sales Report, which shows that profit margins on median-priced single-family home and condo sales in the United States increased to 59 percent in the third quarter – the second straight quarterly increase following several declines.
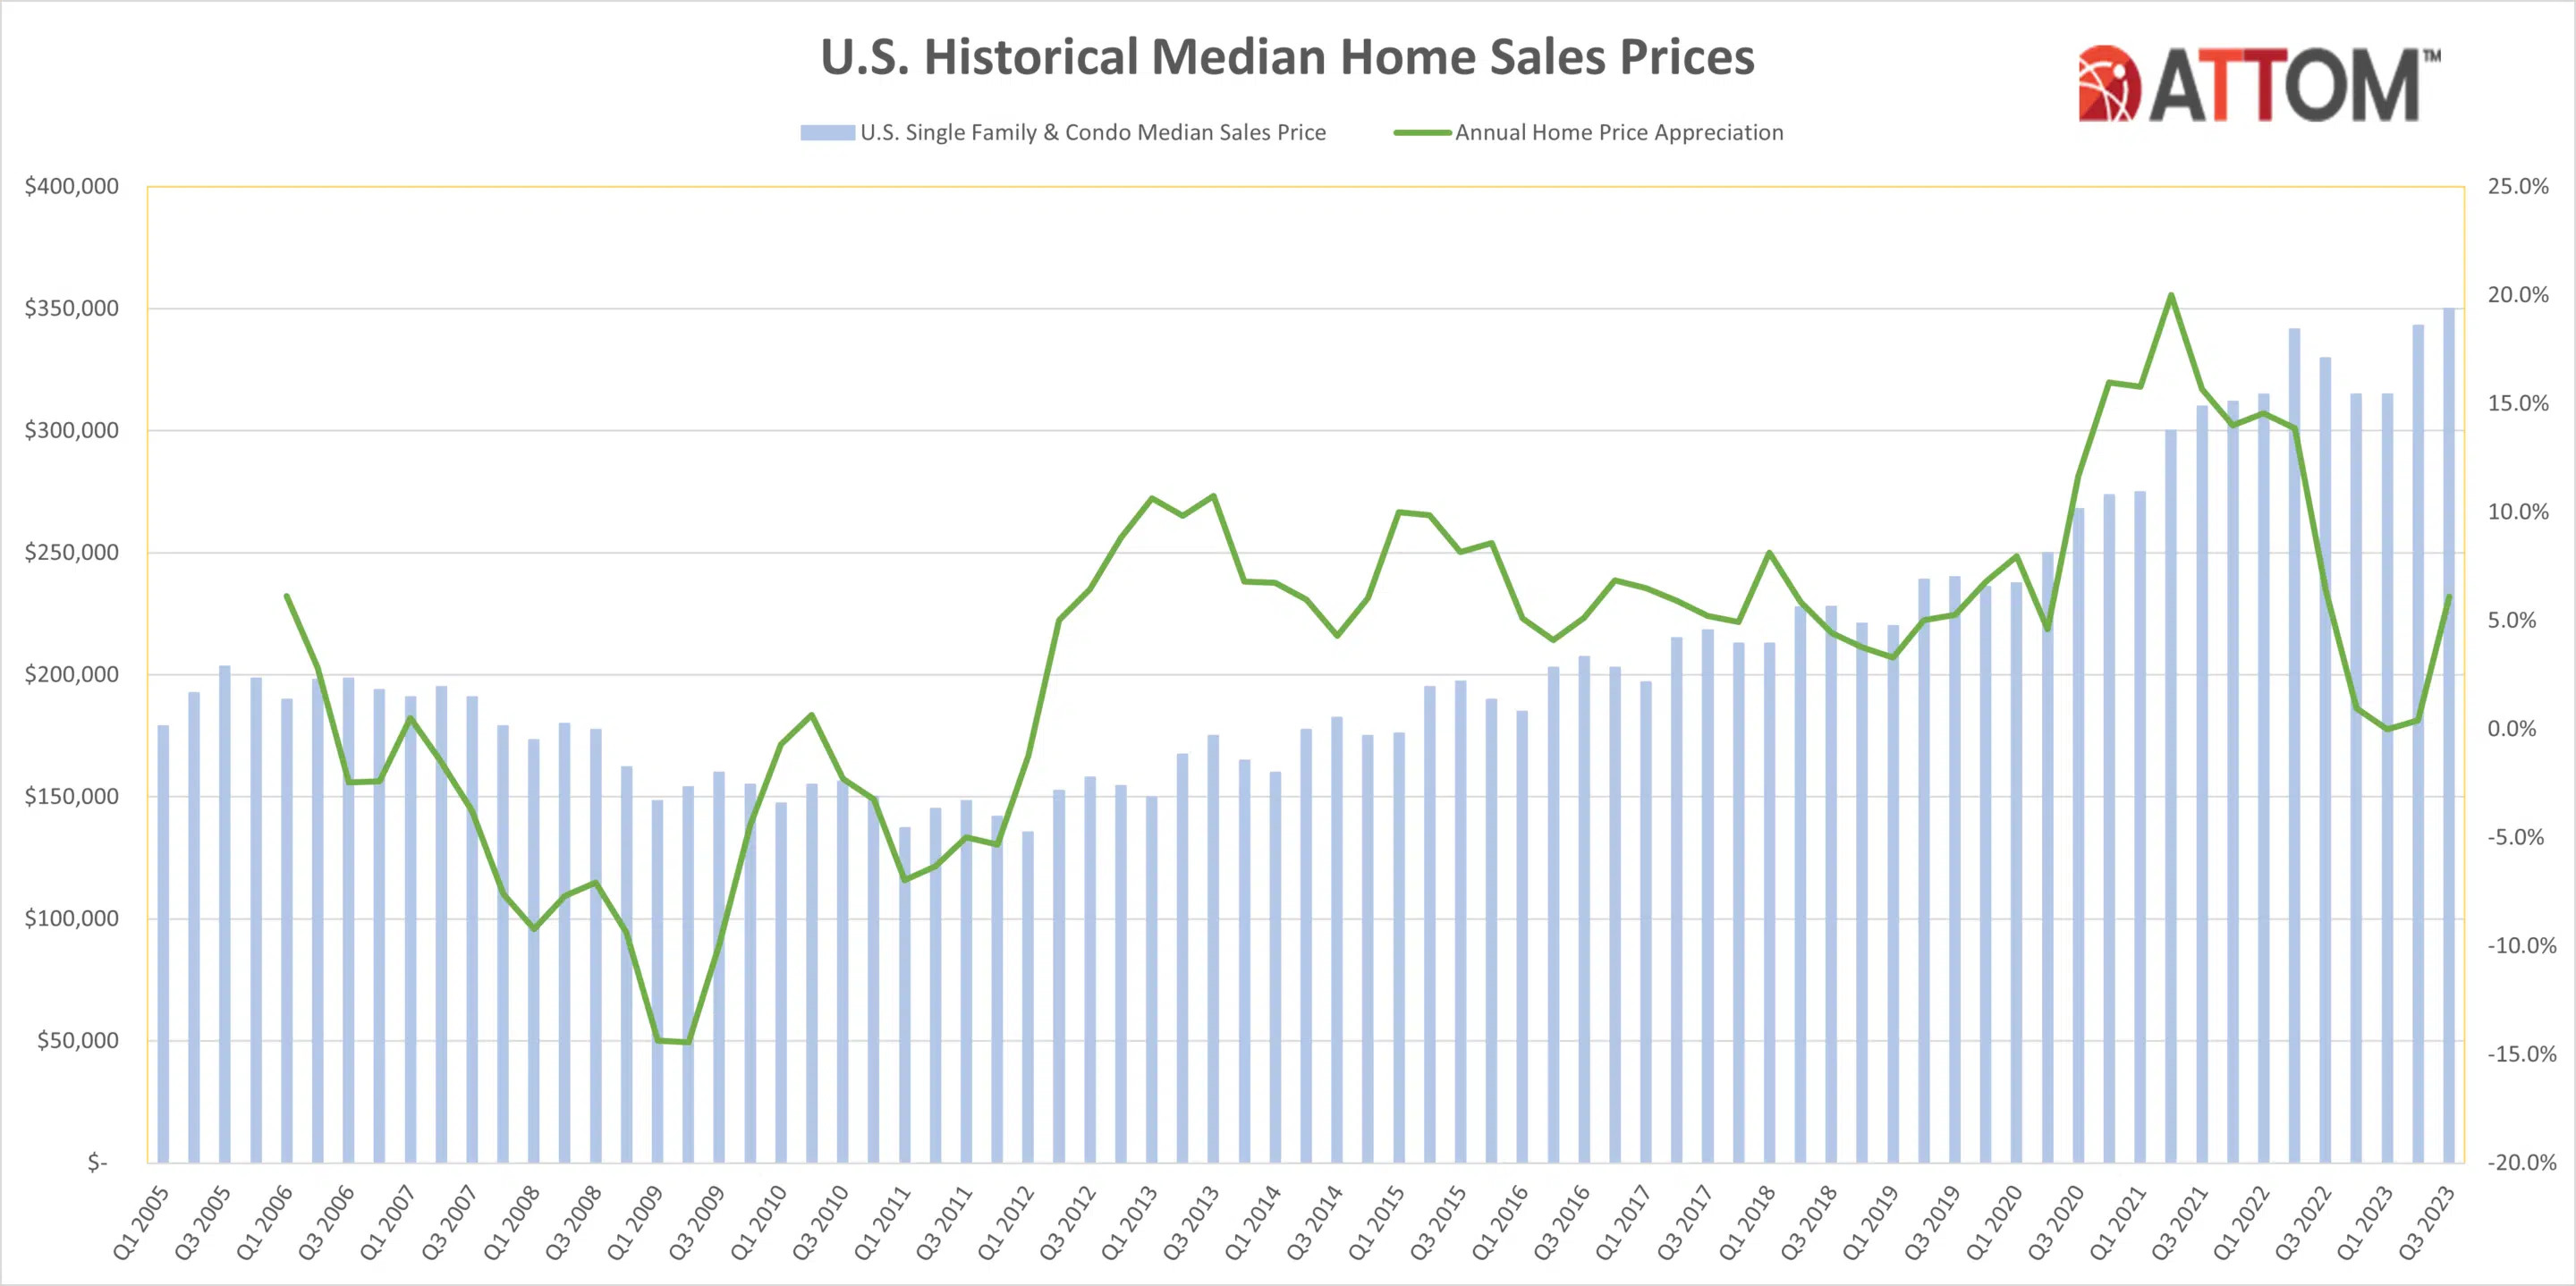
The improvement in typical profit margins, from 56.6 percent in the second quarter of 2023, came amid a continued rebound in the U.S. housing market that pushed the median nationwide home price up 2 percent to a new high of $350,000. Both the nationwide profit margin and median home price have increased since an unusual decline from the middle of 2022 to the early part of 2023 that had threatened to reverse a decade-long market boom.
However, even as seller fortunes improved again in the third quarter, the typical investment return nationwide did remain below the 62 percent level recorded in the third quarter of 2022 and a high point of 62.3 percent in the second quarter of last year.
"Prices and profits around the U.S. got another boost over the Summer as the housing market continued recovering from last year's setbacks," said Rob Barber, chief executive officer for ATTOM. "Things do remain uncertain heading into the market's annual Fall slowdown, especially at a time when mortgage rates are rising again, home affordability is getting tougher and the potential for a recession hangs in the air. But the latest gains fell in line with what we often see during the third quarter and showed that any predictions of an extended market fallback may have been premature."
Gross profits on typical single-family home and condo sales across the country also went up during the third quarter of 2023. They rose 5 percent quarterly, to $129,900, and were up 3.2 percent annually.
The continued gains in profits and prices around the U.S., while representing typical growth for a third-quarter period, still came amid a mix of forces that could turn the market up or down over the coming months.
Both measures improved over the Summer as the supply of homes for sale in the U.S. remained historically low. That put upward pressure on prices, which, by extension, helped to push up profits. But mortgage rates started increasing again in the third quarter, rising toward an average of 8 percent for 30-year fixed loan following a stable second quarter. Consumer-price inflation also ticked back up after dropping dramatically over the prior year from 9 percent to 3 percent, while the stock market declined and the national unemployment rate rose close to 4 percent.
Profit margins grow quarterly in roughly half the country but remain down annually
Typical profit margins – the percent difference between median purchase and resale prices – increased from the second quarter of 2023 to the third quarter of 2023 in 85 (55 percent) of the 155 metropolitan statistical areas around the U.S. with sufficient data to analyze. However, they were still down annually in 103, or 66 percent, of those metros as the recent improvements were not enough to wipe out the earlier losses.
That happened as the third-quarter improvement in home prices outpaced smaller increases that recent sellers had been paying when they originally bought their homes. Larger gains at the point of resale translated into higher profit margins.
Metro areas were included if they had sufficient population and at least 1,000 single-family home and condo sales in the third quarter of 2023.
The biggest quarterly increases in typical profit margins came in the metro areas of Scranton, PA (margin up from 72.2 percent in the second quarter of 2023 to 92 percent in the third quarter of 2023); Reading, PA (up from 70.3 percent to 88.5 percent); Flint, MI (up from 66.7 percent to 84.6 percent); Evansville, IN (up from 32.9 percent to 45.9 percent) and Roanoke, VA (up from 44.4 percent to 56.3 percent).
The biggest quarterly profit-margin increases in metro areas with a population of at least 1 million in the third quarter of 2023 were in Birmingham, AL (return up from 41.2 percent to 50.9 percent); Buffalo, NY (up from 73.9 percent to 82.9 percent); Rochester, NY (up from 65.4 percent to 71.9 percent); Kansas City, MO (up from 44.5 percent to 50.2 percent) and Tucson, AZ (up from 59.1 percent to 64.8 percent).
Typical profit margins decreased quarterly in 70 of the 155 metro areas analyzed (45 percent). The biggest quarterly decreases were in Lake Havasu City, AZ (margin down from 101.7 percent in the second quarter of 2023 to 81.6 percent in the third quarter of 2023); Albany, NY (down from 44.8 percent to 27.4 percent); Naples, FL (down from 84.5 percent to 73.7 percent); Bakersfield, CA (down from 76.1 percent to 65.9 percent) and Tallahassee, FL (down from 73.8 percent to 63.6 percent).
The largest quarterly decreases in profit margins among metro areas with a population of at least 1 million came in San Jose, CA (down from 105.4 percent to 98.1 percent); Fresno, CA (down from 77.1 percent to 70.8 percent); Raleigh, NC (down from 61.9 percent to 56.3 percent); San Diego, CA (down from 78.7 percent to 73.8 percent) and Austin, TX (down from 50.3 percent to 45.5 percent).
Metro areas with a population of at least 1 million where typical profits remained down the most annually included Austin, TX (margin down from 68.8 percent in the third quarter of 2022 to 45.5 percent in the third quarter of 2023); Honolulu, HI (down from 69.9 percent to 50.6 percent); Phoenix, AZ (down from 80 percent to 61.9 percent); Raleigh, NC (down from 73.9 percent to 56.3 percent) and Nashville, TN (down from 84 percent to 68 percent).
Raw profits up in almost two-thirds of U.S.
Profits on median-priced home sales nationwide, measured in raw dollars, increased from $123,716 in the second quarter of 2023 to $129,900 in the third quarter, a 5 percent gain. Typical raw profits went up quarterly in 95, or 61 percent, of the metro areas analyzed for this report.
Measured annually, the typical nationwide raw profit also was up, by 3.2 percent, from $125,875 in the third quarter of 2022. The figure rose year over year in 54 percent of the markets analyzed.
The biggest quarterly raw-profit increases in areas with a population of at least 1 million were in Buffalo, NY (up 22 percent); New York, NY (up 15 percent); Birmingham, AL (up 13 percent); Rochester, NY (up 13 percent) and Kansas City, MO (up 11 percent).
On an annual basis, the largest improvements in raw profits on median-priced home sales among metros with a population of at least 1 million came in Hartford, CT (up 33 percent); Rochester, NY (up 24 percent); Chicago, IL (up 15 percent); Cincinnati, OH (up 13 percent) and Buffalo, NY (up 13 percent).
Eighteen of the top 20 largest raw profits on median-priced sales in the third quarter of 2023 were along the northeast or west coasts. They were led by San Jose, CA (profit of $718,000); San Francisco, CA ($485,000); San Diego, CA ($361.000); Los Angeles, CA ($347,233) and Seattle, WA ($331,938).
Nineteen of the smallest 20 raw profits were in the Midwest or South. The lowest were in Shreveport, LA ($2,744); Beaumont, TX ($24,312); Peoria, IL ($37,500); Lubbock, TX ($44,725) and McAllen, TX ($47,030).
Prices up in almost three-quarters of nation
Median single-family home and condo prices increased from the second to the third quarter of 2023 in 110 (71 percent) of the 155 metro areas around the country with enough data to analyze, and were up annually in 125 of those metros (81 percent).
Nationwide, the median home price rose to a new high of $350,000, up 2 percent over the previous record of $343,000 in the second quarter of 2023 and 6.1 percent from $329,900 in the third quarter of last year.
Metro areas with the biggest increases in median home prices from the second quarter of 2023 to the third quarter of 2023 were Buffalo, NY (up 14.7 percent); Scranton, PA (up 11.4 percent); Trenton, NJ (up 11.1 percent); New York, NY (up 9.9 percent) and Syracuse, NY (up 9.8 percent).
Aside from Buffalo and New York, the largest quarterly median-price increases in metro areas with a population of at least 1 million were in Detroit, MI (up 7.8 percent); Hartford, CT (up 6.3 percent) and Philadelphia, PA (up 6.3 percent).
Home prices tied or hit new highs during the third quarter of 2023 in 86, or 55 percent, of the 155 metro areas in the report. Metro areas with a population of more than 1 million that set or tied records in the third quarter included New York, NY; Chicago, IL; Philadelphia, PA; Miami, FL, and Atlanta, GA.
Metro areas with a population of at least 1 million where the median home price declined most from the second to the third quarter of 2023 included New Orleans, LA (down 5.2 percent); Indianapolis, IN, (down 4.6 percent); San Francisco, CA (down 4.4 percent); Austin, TX (down 4 percent) and Dallas, TX (down 3 percent).
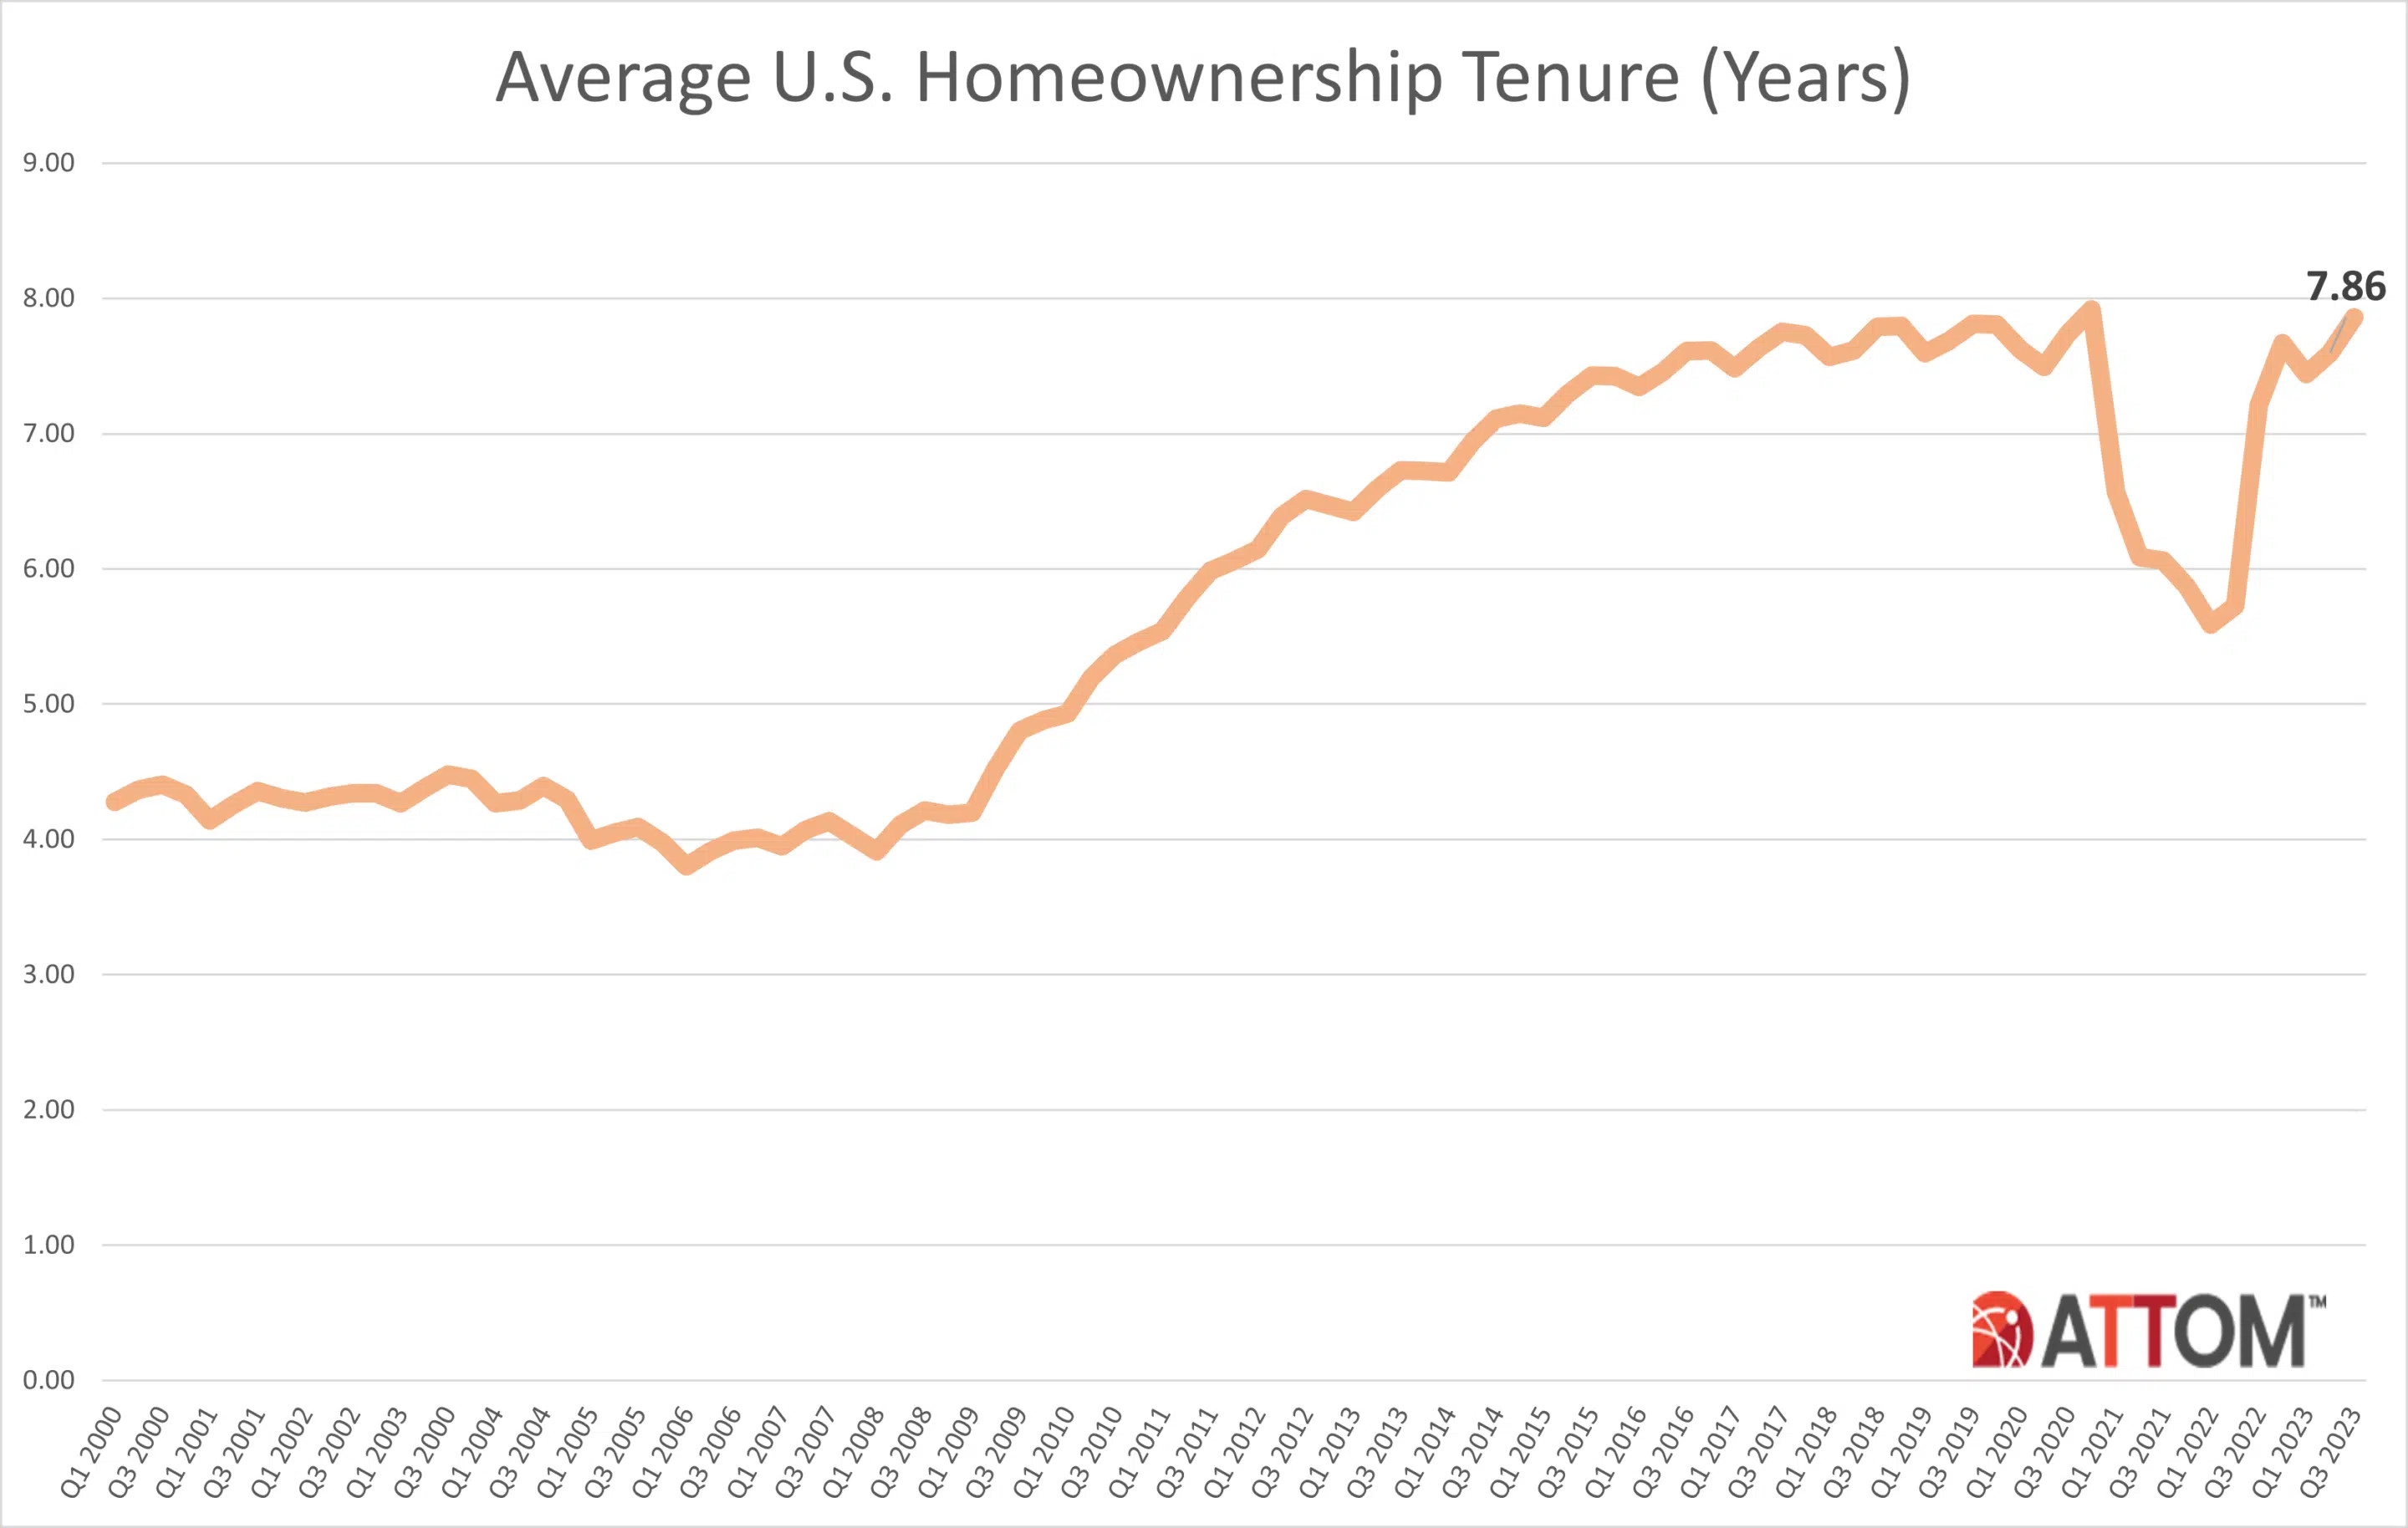
Homeownership tenure up close to high point for this century
Homeowners who sold in the third quarter of 2023 had owned their homes an average of 7.86 years, which marked the second highest point since 2000. The latest figure was up from 7.6 years in the second quarter of 2023 and from 7.21 years in the third quarter of 2022.
Average tenure was up from the third quarter of 2022 to the same period this year in 96 percent of metro areas with sufficient data. The largest annual increases were in Santa Barbara, CA (tenure up 32 percent); Madera, CA (up 27 percent); Santa Rosa, CA (up 27 percent); Truckee, CA (up 24 percent) and Santa Cruz, CA (up 21 percent).
The top 40 longest average tenures among sellers in the third quarter of 2023 were in the Northeast or West regions of the U.S. They were led by Barnstable, MA (13.84 years); Bridgeport, CT (12.79 years); Norwich, CT (12.59 years); Santa Rosa, CA (12.58 years) and Boston, MA (12.56 years).
The smallest average tenures among third-quarter sellers were in Provo, UT (6.44 years); Austin, TX (6.46 years); Crestview-Fort Walton Beach, FL (6.47 years); Oklahoma City, OK (6.57 years) and Lakeland, FL (6.57 years).
Lender-owned foreclosure sales remain near low point since 2000
Home sales following foreclosures by banks and other lenders represented just 1.4 percent, or one of every 73 U.S. single-family home and condo sales in the third quarter of 2023. That was down from 1.5 percent in the second quarter of 2023, although up from 1.1 percent in the third quarter of last year. Still, it remained just a tiny fraction of the 30 percent peak this century hit in early 2009 during the aftermath of the Great Recession of 2007.
Among metropolitan statistical areas with sufficient data, those areas where REO sales represented the largest portion of all sales in the third quarter of 2023 included Flint, MI (6.2 percent); Macon, GA (5.8 percent); Hilo, HI (4.1 percent); Lansing, MI (3.4 percent); and Chicago, IL (3.3 percent).
Cash sales up
Nationwide, all-cash purchases accounted for 36.6 percent of single-family home and condo sales in the third quarter of 2023. That was up slightly from 36.4 percent in the second quarter of 2023 and up from 35.2 percent in the third quarter of last year.
"The level of cash sales has inched up over the past year as mortgage rates in the U.S. have continued their march higher, now close to an average of 8 percent for a 30-year loan," Barber said. "If rates keep rising, that should continue creating favorable conditions for more all-cash deals."
Among metropolitan areas with a population of 200,000 or more and sufficient cash-sales data, those where cash sales represented the largest share of all transactions in the third quarter of 2023 included Athens, GA (63.3 percent); Myrtle Beach, SC (60 percent of all sales); Macon, GA (58.9 percent); Claremont, NH (56.8 percent) and Naples, FL (56 percent).
Those where cash sales represented the smallest share of all transactions in the third quarter of 2023 included Greeley, CO (16.3 percent); Boulder, CO (19.7 percent); Cedar Rapids, IA (21.6 percent); Washington, DC (21.7 percent) and Vallejo, CA (21.7 percent).
Institutional investment drops to three-year low
Institutional investors nationwide accounted for 5.9 percent, or one of every 17 single-family home and condo purchases in the third quarter of 2023. That was down from 6.2 percent in the second quarter of 2023 and from 7.6 percent in the third quarter of 2022, to the lowest point since the fourth quarter of 2020.
Among states with enough data to analyze, those with the largest percentages of sales to institutional investors in the third quarter of 2023 were Oklahoma (8.8 percent of all sales), Tennessee (8.7 percent), Texas (8.4 percent), Georgia (8 percent) and Indiana (7.9 percent).
States with the smallest levels of sales to institutional investors in the third quarter of 2023 included Hawaii (1.9 percent of all sales), Rhode Island 2.9 percent), Maine (3 percent), New Hampshire (3 percent) and Louisiana (3.2 percent).
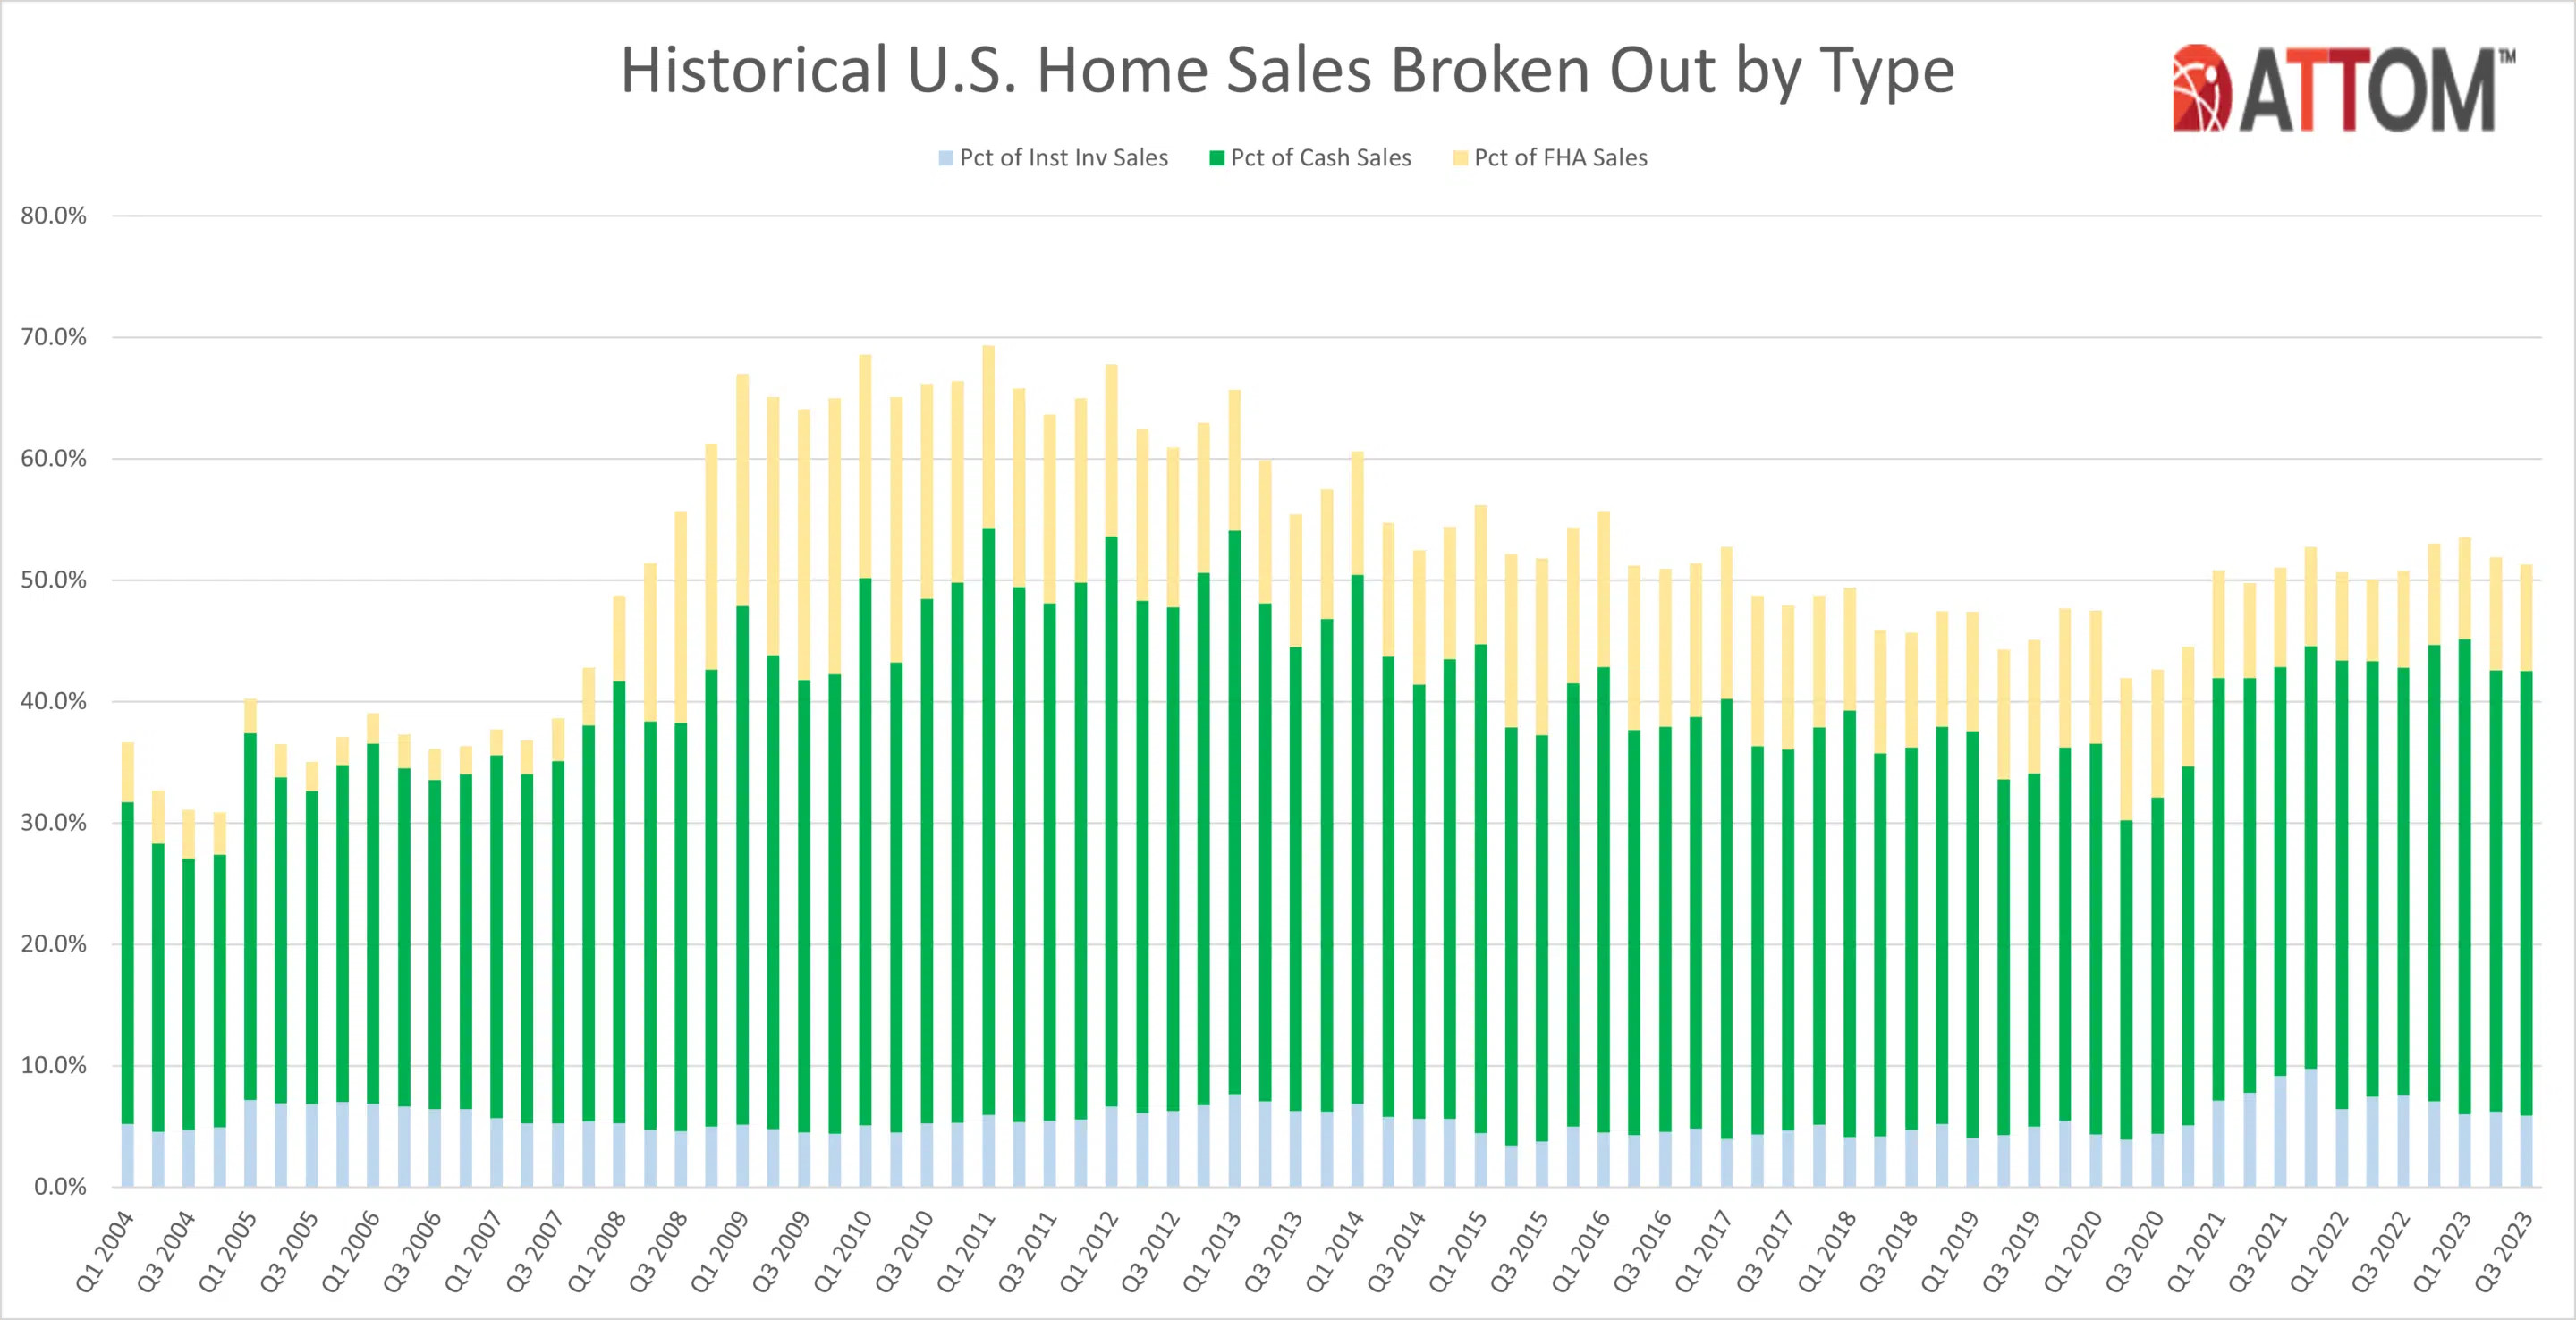
FHA-financed purchases down quarterly, up annually
Nationwide, buyers using Federal Housing Administration (FHA) loans comprised 8.8 percent of all single-family home purchases in the third quarter of 2023 (one of every 11). That was down from 9.3 percent in the second quarter of 2023 but still up from 8 percent a year earlier.
Among metropolitan areas with sufficient FHA-buyer data, those with the highest levels of sales to FHA purchasers in the third quarter of 2023 included Merced, CA (25.3 percent); Lakeland, FL (24.3 percent of all sales); Bakersfield, CA (22.9 percent); Yuma, AZ (20.5 percent) and Visalia, CA (20.1 percent)).
Report methodology
The ATTOM U.S. Home Sales Report provides percentages of REO sales and all sales that are sold to institutional investors and cash buyers, at the state and metropolitan statistical area. Data is also available at the county and zip code level, upon request. The data is derived from recorded sales deeds, foreclosure filings and loan data. Statistics for previous quarters are revised when each new report is issued as more deed data becomes available.
About ATTOM
ATTOM provides premium property data to power products that improve transparency, innovation, efficiency and disruption in a data-driven economy. ATTOM multi-sources property tax, deed, mortgage, foreclosure, environmental risk, natural hazard, and neighborhood data for more than 155 million U.S. residential and commercial properties covering 99 percent of the nation's population. A rigorous data management process involving more than 20 steps validates, standardizes, and enhances the real estate data collected by ATTOM, assigning each property record with a persistent, unique ID — the ATTOM ID. The 30TB ATTOM Data Warehouse fuels innovation in many industries including mortgage, real estate, insurance, marketing, government and more through flexible data delivery solutions that include bulk file licenses, property data APIs, real estate market trends, property navigator and more. Also, introducing our newest innovative solution, that offers immediate access and streamlines data management – ATTOM Cloud.