
RETECHNOLOGY PREMIUM MARKETPLACE RELATED PRODUCTS | WEBINARS | SPECIAL OFFERS


You are viewing our site as a Broker, Switch Your View:
Agent | Broker Reset Filters to Default Back to ListHow to Be Successful Posting on Pinterest: The Infographic
December 20 2016
 Want to have your pins re-pinned like crazy on Pinterest?
Create an infographic.
A few years ago I created this infographic about How to Ensure Your Success as a Real Estate Blogger.
After publishing it on my website, I pinned it to Pinterest.
I had at times noticed that it was repinned quite a bit, but never paid much mind to it. Then yesterday I looked at the stats and saw that it has been re-pinned over 3,100 times. Holy cow! I looked at the stats on all my other pins and saw that of nearly 300 pins, my second highest pinned image is 66 times (and the third highest is just 33 pins). That's almost 50 times the amount of pinning!
The thing is, creating that infographic took me 50 times longer than any of the images I posted on Pinterest. So you could say I got out of it what I put in. I haven't created another infographic since then because of the time it took to do that first one (a few hours).
That is, until today!
Turns out making infographics is no longer the massive chore it was just a few years ago.
Using a tool Canva.com, you can create a great looking, super-shareable infographic in about 30 mins. If the results are anything like my first infographic, I plan on doing a lot more of these.
How to Make a Successful Infographic
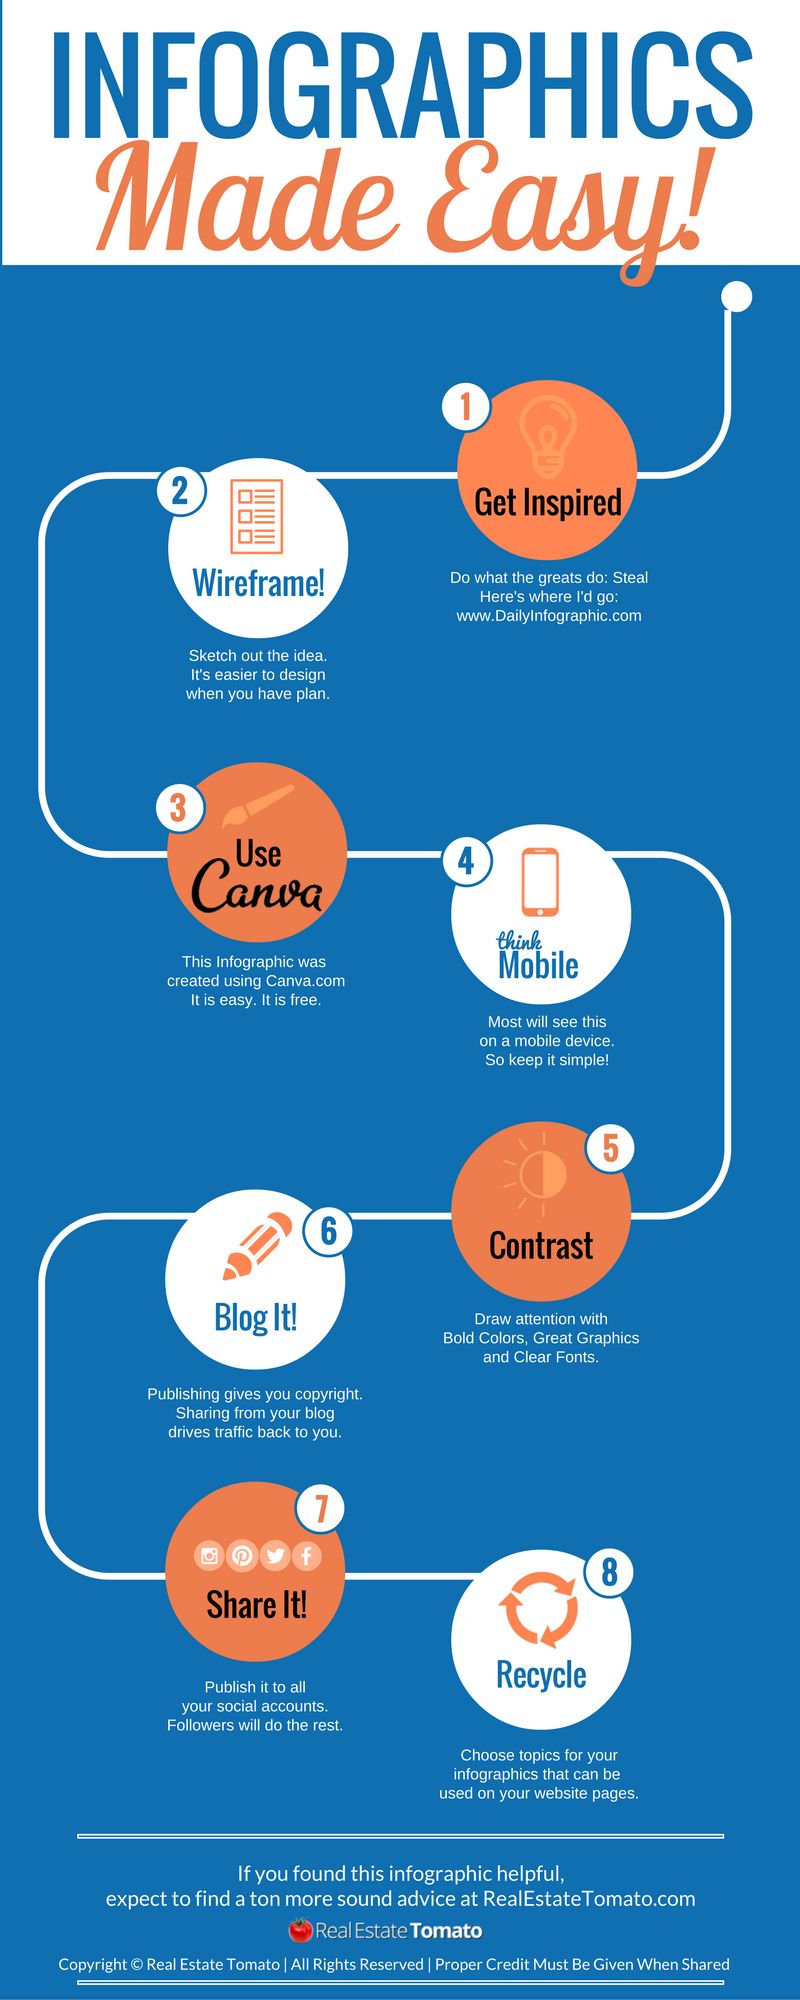
The above infographic was designed to be easily noticed and digested. On the next page is a little more insight on the included eight points.
Get Inspired
Rather than staring at a blank canvas, look at what others have done successfully before you. Save a few favorites for inspiration and borrow from them the ideas you need. This site has a ton of great examples that will get your creativity flowing: DailyInfographic.com. This Pinterest board has a ton of real estate related infographics.
Once you have a solid inspiration, you can use Canva's infographic templates to design your vision.
Wireframe
Sketch out the whole concept on paper. It's much easier and faster to work with the rough draft than with the design program. I also found that I was able to come up with several solid ideas for future infographics as I was sketching out this one. Now I have a notebook with a bunch of pages of ideas all ready to go.
Use Canva
Canva.com – they are just what the novice designer needs. Drag and drop content, simple editors, tons of free templates and graphics and, most importantly, guidelines to keep everything in place. I loved using it to create the infographic above. You can also buy premium graphics for as little as $1. I was able to keep my project free by designing some of my own images for the icons – which is another nice feature: upload your own graphics.
Think Mobile
My website analytics show that 40 percent of my audience is mobile. But the analytics on my Facebook, Twitter, Instagram, and Pinterest profiles show that number to by upwards of 75 percent. So at this point, I would design the infographic for the mobile audience. Keep the message clear and simple. Overly complicated infographics with lots of images and data will not be appreciated by your mobile audience.
Contrast
Contrast gets you noticed. Contrast draws attention to the flow of the message. Use bold colors, bold fonts, attractive images, and enough white space to keep your audience on track.
Blog It
All your best content should originate on your blog. It will last forever there, well organized, well indexed (SEO), and clearly attributed to you. From there, you can share it everywhere else.
Share It
Great content is meant to be shared. Get it in front of as many people as you can and then let them do the rest of the work. I shared that original infographic just one time on Pinterest, and it was re-pinned over 3,100 times. I'm going to dust it off and share it on Facebook, Instagram, and Twitter.
Recycle
Not only does the infographic make for great blog content and social media fodder, but it can be incredibly useful on your website pages. If you create an infographic on the home selling process, this would be an amazing asset to your selling pages on your website. If you have your website in mind when you consider your infographics, you can really make use of them over and over.
To view the original article, visit the Real Estate Tomato blog.