
RETECHNOLOGY PREMIUM MARKETPLACE RELATED PRODUCTS | WEBINARS | SPECIAL OFFERS


You are viewing our site as a Broker, Switch Your View:
Agent | Broker Reset Filters to Default Back to ListHome Prices
September 14 2011
Here's the latest from Ted Jones on the Stewart Title blog.
Homes had long been considered as a place to live and one that would keep pace with inflation. In fact, from 1987 through 2009, home values (per the Case-Shiller Index) appreciated at 3.9 percent compound annually while inflation ran 2.9 percent (see post from March 2010). So housing was yielding a price dividend of 1 percent per year (in real—inflation adjusted terms), not to mention the huge dividend that you got to live in or rent the property. Once again, though, I invoke the TINSTAANREM clause. (There Is No Such Thing As A National Real Estate Market). Each real estate market is different, and within those markets, submarkets are likewise diverse.
But then we made housing an investment and when you consider housing as an investment, you need to compare it to other opportunities over a long period of time. Our retirement accounts, for example, typically consist of stock funds or indexes, in some circumstances individual stocks and often bonds. These investments frequently accumulate for forty or more years—just as does housing.
So how would you respond if I told you that housing was less volatile than the stock market and can compete with the stock markets performance?
To address this, indices for the SP:500 and the DJIA (monthly) and existing median home prices were averaged for 12 months (to remove the month-to-month noise) and then Indexed where January 2001 = 100.
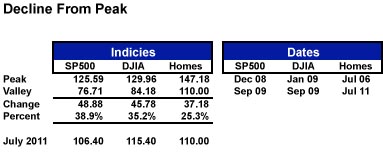
The graph below is pretty revealing. Essentially, if you bought into the SP500, or the Dow Jones Industrial Average, or a median priced-home in January 2002, your payoff today is very similar. The SP500 index is 106.4, housing is 110 and the DJIA is 115.4. So housing—even though it is down 25 percent—continues to have declined less in the peak-to-valley cycle than the SP500 and DJIA since 2002.

The following table shows the respective index levels, change, dates and percentages for these three ‘investments’. Housing has declined (thus far—and we have no idea if this is the floor or not) by 25.3 percent from the peak. Yet from January 2009 to September 2009 the DJIA dropped 35.2 percent while the SP500 plunged 38.9 percent (December 2008 through September 2009).
This is not to say that all housing markets in the U.S. have performed at this level (nor have all stocks performed likewise). Just as housing markets in Florida, Arizona and Nevada are off 50 percent since the peak, some stock are off even more (one of our competitors stock price went from approximately $100 per share to zero in this same period due to bankruptcy).
Nor are the dividends comparable between stocks and housing. Since 2000s, the average annual dividend rate for the SP500 has been 1.8 percent. The U.S. Census Bureau reports median asking rents and asking home prices since 2002 have averaged $639 and $143,000, respectively. If you compare the annual rent rate as a percentage of home value, housing is effectively yielding a 5.36 percent dividend (and this is a very simplistic approach as it ignores other homeowner expenses as does it ignore the tax advantages of owning a home).
The bottom line is that housing surprisingly as an investment, when compared to stock market investments since 2002 is more than holding its own on average (although we cannot ignore the hard-hit individual stocks and the housing markets nor those stocks and home markets that continue to outperform).
In my opinion, this is a great time to overweight into the real estate investment side.
To view the original post, click here.