RPR's Data Partners: Your Secret Weapon in Commercial Real Estate
RPR (Realtors Property Resource) offers commercial real estate practitioners a wealth of listing and property data, plus access to an array of analytical and ROI-focused tools.
With over 800K listings, 57 million off-market property records, site selection tools, consumer demographic research, trade area data, traffic counts, POIs (points of interest) and more, RPR Commercial is basically a one-stop-shop for all things CRE.
However, one question we hear over and over is: where does RPR get all of this commercial data and information? As an aggregator of data and resources, RPR is the ultimate commercial hub for REALTORS® to conduct commercial real estate business.
In this article, we'll present our impressive list of commercial partners by what category they fall under and how our partnership can help you in your daily commercial duties.
RPR Commercial partnerships can help power your business
RPR has collabs, partnerships and affiliations with some of the biggest names in commercial real estate. Here's a list, by category:
For Sale/For Lease Data Partners
Brevitas: Brevitas is a national commercial listing platform that is integrated into RPR. Their real estate marketplace provides REALTORS® a turn-key marketing solution and an instant competitive edge by offering a robust collection of property search and marketing tools.
CREXi: CREXi offers a database of commercial listings, including more than 48 million property records. It also provides RPR with daily updated data, which helps commercial real estate professionals quickly manage deals and close them faster.
TotalCommercial: TotalCommercial.com has been providing commercial real estate listing information online since 1995. TotalCommercial.com shares its listing information through RPR to offer REALTORS® more listings and more property research resources.
Land Broker MLS: LandBrokerMLS.com was formed in 2018 by real estate brokers and agents to assist rural real estate professionals in their ability to view land listings. LandBrokerMLS contributes listing data to RPR's commercial platform.
Biproxi: Biproxi's new public marketplace is called Officespace.com and it provides powerful listing capabilities for "for sale" and "for lease" properties. Biproxi's Officespace.com provides listing information for RPR's commercial real estate users.
Catylist: Moody's Analytics Catylist offers a commercial property listing and marketing solution to numerous REALTOR® associations and CIEs (Commercial Information Exchanges). It helps RPR receive licensed commercial listing content from many markets across the country.
CompStak: CompStak is a nationwide crowdsourced commercial comp database that offers RPR users to receive 500 free credits to search and share commercial comparables. Get started by clicking on the CompStak logo in the Additional Resources section of any RPR commercial property page.
Officespace.com: See BiProxi above.
ICSC: ICSC, The International Council of Shopping Centers, has a special agreement with RPR to offer retail and commercial real estate data, which contributes significant insight relevant to the shopping center industry and broader commercial sectors.
Off-Market Properties
Black Knight: Black Knight is the backbone of RPR property data. It provides RPR users with quick access to public records including tax details, zoning, ownership information down to the corporate level, and much more, including Assessment and Recorder datasets.
Site Selection Data
Esri: Esri is RPR's main source of consumer data. It supplies RPR with economic, demographic, and spending data, as well as tapestry segment profiles. This particular data fuels RPR analytical tools such as Trade Area Reports and Site Selection Analysis.
Financial Analysis
Valuate: Valuate® is a web-based financial analysis and marketing tool for the purchase and sale of commercial and residential investment properties. From RPR, users can easily access the platform to perform real-time, interactive ROI analyses in a collaborative work environment.
Traffic Counts
Kalibrate: Kalibrate powers the traffic counts found on RPR's commercial maps. They provide this data quarterly from various sources, including governments, transportation departments, and Kalibrate's own field verifications.
Tenant Data
SMR Research: SMR works with RPR to provide a proprietary database of 25 million U.S. companies, schools, and other institutions for commercial property insights, and the data is updated quarterly.
ClimateRisk Assessment and Mitigation
Climate Check: ClimateCheck®, available in the RPR "Additional Resources" section, offers an assessment of a property's climate risk. It will rate a property's future risk of climate change-related hazards and assign a rating from 1 to 100, with 100 representing the highest risk.
Risk Factor: Also available in the RPR "Additional Resources," Risk Factor provides climate and environmental risk data for real estate properties, helping REALTORS® understand and communicate potential risks related to climate change.
Existing Businesses (POIs – Points of Interest)
Data Axle: Known for its robust business databases, Data Axle provides detailed company profiles and other commercial real estate-related data to enhance the commercial offerings on RPR.
Esri: Supplies RPR with economic, demographic, and spending data, as well as tapestry segment profiles.
RPR: Commercial listings, data and tools–all under one roof
As you can see, RPR brings a vast amount of commercial resources and data and puts them all in one place so you can search listings, conduct research and tap into resources that help your clients make data-backed decisions. And if you're a REALTOR®, there's no extra charge to use as part of your membership in The National Association of REALTORS®.
However, if our impressive list of commercial partnerships doesn't convince you, listen to what Dave Ferro, Managing Broker and Vice President of Watson Realty Corp in Gainesville, Florida, has to say about RPR Commercial: "I go to RPR Commercial to save time and simplify. That perfectly sums it up for me. I don't have to go to each individual's website for listing info. I can see all my properties and deals in one location. It's such a great place to search, every commercial agent should try it."
To view the original article, visit the RPR
MORE >

RETECHNOLOGY PREMIUM MARKETPLACE RELATED PRODUCTS | WEBINARS | SPECIAL OFFERS


You are viewing our site as an Agent, Switch Your View:
Agent | Broker Reset Filters to Default Back to ListRPR for Commercial
 |
|
| Comprehensive data clients require, all in one place, just for REALTORS® Your one-stop-shop for comprehensive market data, allowing REALTORS® specializing in commercial properties to save time and money. RPR Commercial is your REALTOR® benefit, already incorporated into your REALTOR® dues. |
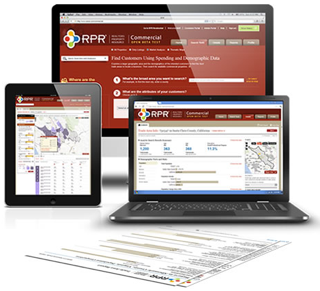 |
| Where are the right customers for a business? Using democraphic, psychographic and spending data information, RPR helps you identify areas of high concentrations of the customers your client is looking for. |
 |
 |
What's the best location for a business? Help business owners find the best location based on an analysis of spending dta within a drive time, radius, or general area. Find the optimum site for a specific business type like restaurant, coffee or apparel shop, etc. |
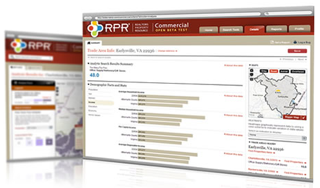
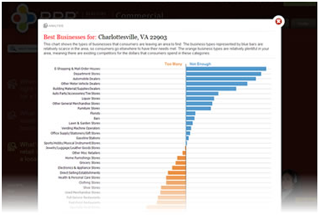
| What's the best retail business for a location? Determine what business would be appropriate for a given location by examining spending data and what business types are underserving the area. Receive results in a chart indicating which business types are over and underrepresented in a specific area. |
 |
 |
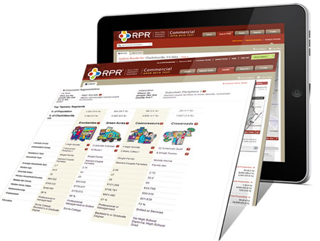
Powerful Thematic Maps View demographic information overlaid in your defined area of interest, allowing you to see locations with the highest concentration of the indicator. |
| Comprehensive Reporting Provide your client with the best reports in the business in just a few minutes! Whether your client is looking for a detailed trade area report, business opportunities chart or a property report, RPR Commercial reports are guaranteed to impress. |
 |
Related Articles
RPR's Data-Driven Revolution: Shaping the Future of Commercial Real Estate Decision Making
In the digital era, data is king. And in the world of commercial real estate, this trend is particularly pronounced.
As the sector becomes increasingly data-driven, commercial real estate pros need to be able to collect, analyze and interpret data in order to make informed decisions. This means being able to use data to identify trends and assess risk. It also adds to making strategic decisions about where to invest, how to manage properties, and how to market properties.
The Current State of Data Use in Commercial Real Estate
Today, commercial real estate pros are leveraging RPR's rich data offerings to enhance their decision-making processes. By providing access to over 800,000 listings and 57 million off-market properties, RPR empowers REALTORS® to conduct comprehensive property searches, analyze potential investment opportunities, and make well-informed decisions.
For example, RPR's demographic and economic data can be used to identify areas with high consumer spending or high population growth-factors that are crucial when determining the ideal location for a new business.
A perfect example of this is a case where a REALTOR® from Texas used RPR's Commercial Site Selection tool to find the perfect location for a trendy cookie bakery. By leveraging RPR's extensive data, including demographics, traffic patterns, and points of interest, the REALTOR® was able to find a location that was a perfect fit for the bakery's target audience. This is a prime example of how RPR's data-driven tools can guide commercial practitioners in making informed decisions for their clients.
The Impact of Data on Decision Making
RPR's platform includes advanced mapping features, such as Points of Interest, traffic counts, and data layers. These tools enable REALTORS® to conduct a more detailed analysis of potential locations, taking into account factors that may influence a property's desirability and value. For example, traffic counts can provide insights into a location's visibility and accessibility, while data layers can offer a deeper understanding of the surrounding area's demographics, infrastructure and environmental factors.
The Future of Data-Driven Decision-Making in Commercial Real Estate
Looking ahead, the role of data in commercial real estate decision-making is set to become even more significant. Advancements in technologies such as artificial intelligence and machine learning could enable more complex data analyses and predictions. This could lead to a better understanding of market trends and a more accurate prediction of future property values.
Moreover, the future could also see more personalized insights. Using RPR, practitioners could offer tailored property recommendations to clients based on their specific needs and preferences, enhancing the customer experience.
The Role of RPR in Shaping this Future
RPR is well-positioned to lead the commercial real estate industry into this data-driven future. With its commitment to providing comprehensive and accurate data, and its ongoing efforts to integrate advanced technologies into its platform, RPR is at the forefront of this revolution.
Furthermore, RPR's user-friendly interface and easy-to-use tools make its wealth of data accessible to all, regardless of their level of technical expertise. This democratization of data is a critical step towards a future where all commercial real estate decisions are data-driven.
Data-driven decision-making is transforming the commercial real estate industry, improving accuracy, reducing risk and uncovering hidden opportunities. As the sector navigates the complexities of the digital age, the importance of platforms like RPR cannot be overstated. By providing comprehensive, accurate, and accessible data, RPR is not just keeping pace with the industry's evolving needs, but is actively shaping the future of commercial real estate.
To view the original article, visit the RPR
MORE >
RPR Commercial: Traffic Data You Can Count On
When it comes to advising commercial real estate investors and business owners on site selection, it's a smart move to factor in traffic count data.
In this article, we'll show you how RPR (Realtors Property Resource) provides easy access to traffic data to help you crunch those numbers, gauge potential and guide your clients to optimal locations.
The RPR-Kalibrate data partnership can really benefit a business
Through its partnership with Kalibrate, RPR Commercial offers comprehensive traffic count data to help REALTORS® make informed decisions when assisting clients in site selection. Providing valuable traffic count insight into the potential footfall (the number of people entering a store or shopping area in a given time) and site visibility can be make or break for a new business. The more people who see a business or are exposed to its signage, the more likely they are to visit!
Although counting cars and commuters, and determining annual average daily traffic is not a new idea, many commercial specialists don't utilize the data to properly advise their clients. Here's how to do it in RPR.
Accessing Traffic Count Data in RPR Commercial
Log in to RPR (narrpr.com)
Select Research, and then Commercial Map Insights
Enter a geographic area or zip code or specific address
Select Driving (the car icon to the right) and then Traffic Counts
Choose the range, or simply chose Select All and Apply
Customize the view by zooming in or out and toggling traffic count layers
The traffic data will appear on the map in different colored triangles
Click on specific count points (the triangles) to view the detailed traffic data
Accessing Traffic Count Data in RPR Commercial
Now that we know how to access traffic count data, let's spend a little time on the why. Obviously, the more cars that drive by a business, the better the chances for success. Using this info as a site selection analysis tool can help you and your client(s) in:
Assessing footfall and visibility potential
Identifying prime locations for specific business types
Analyzing trends in traffic flow (morning commutes vs weekend)
Aiding in the decision-making process for clients
Assessing historical data to track growth
Design better delivery routes, if applicable
Speaking of visibility from bullet number one, here's a real world example: perhaps you're familiar with the TV show Bar Rescue, where hospitality consultant Jon Taffer gives bars and restaurants a complete remodel and rebranding. He also often makes it a point to give their signage a facelift, and regularly quotes traffic count data in his reasoning. If 10,000 cars go by each day, they need to be able to see and read your business signage. As a commercial retail specialist with access to RPR, you too can make these recommendations!
Map out your commercial recommendations with RPR traffic counts
With the powerful data layers in RPR's Commercial maps, you can supply your clients with accurate and up-to-date traffic count information. The data will display actual historical counts as well as Kalibrate's projected counts, which are based on the last published traffic count, local area trend data and up-to-date demographic information.
We encourage you to do a search and take our map Driving icon for a spin! This can be a helpful way to give retail businesses an idea of how many people will drive by their business each day and position you as an insightful business advisor.
To view the original article, visit the RPR
MORE >