
RETECHNOLOGY PREMIUM MARKETPLACE RELATED PRODUCTS | WEBINARS | SPECIAL OFFERS


You are viewing our site as an Agent, Switch Your View:
Agent | Broker Reset Filters to Default Back to ListHome Affordability Worsens Across U.S. During Fourth Quarter of 2022 Despite Declining Home Prices
December 28 2022
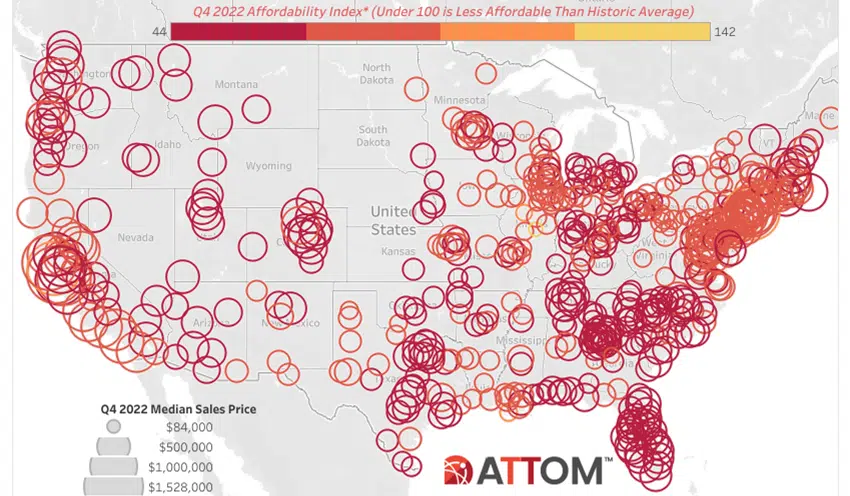
Major Home-Ownership Costs Consume 32 Percent of Average National Wage, Hitting 15-Year High; Portion of Wages Needed to Own Shoots Up as Rising Interest Rates Outweigh Falling Prices
IRVINE, Calif. – Dec. 22, 2022 — ATTOM, a leading curator of real estate data nationwide for land and property data, today released its fourth-quarter 2022 U.S. Home Affordability Report showing that median-priced single-family homes and condos are less affordable in the fourth quarter of 2022 compared to historical averages in 99 percent of counties across the nation with enough data to analyze – far above the 68 percent of counties that were less affordable in the fourth quarter of 2021.
The report further shows that the portion of average wages nationwide required for typical major home-ownership expenses has risen to 32.3 percent this quarter. That figure – considered unaffordable by traditional lending standards – is up from 29.6 percent in the third quarter of this year and from 23.8 percent a year ago. It now stands at its highest point since 2007.
Affordability has worsened due to rising home-mortgage rates in the U.S., which offset the benefits of rising wages and a recent decline in home values. Higher loan rates in 2022 have pushed up major ownership expenses on median-priced homes by 10 percent this quarter even as the median price of single-family homes and condos nationwide dipped 3 percent this quarter, following a 4 percent drop over the Summer. But lower prices and a 1 percent gain in average wages have been too little to make up for the impact of these increased mortgage payments.
"Prospective homebuyers – especially first-time buyers – can't seem to catch a break," said Rick Sharga, executive vice president of market intelligence at ATTOM. "For the past two years home prices have appreciated in double digits – 15 to 20 percent a year in some markets. Now that home prices have plateaued and even declined in some markets, buyers are faced with mortgage rates that have doubled, making home purchases even less affordable."
The report determined affordability for average wage earners by calculating the amount of income needed to meet major monthly home ownership expenses — including mortgage, property taxes and insurance — on a median-priced single-family home, assuming a 20 percent down payment and a 28 percent maximum "front-end" debt-to-income ratio. That required income was then compared to annualized average weekly wage data from the Bureau of Labor Statistics (see full methodology below).
Compared to historical levels, median home prices in 577 of the 581 counties analyzed in the fourth quarter of 2022 are less affordable than in the past. The latest number is up slightly from 572 of the same group of counties in the third quarter of 2022. But it is well up from 393 in the fourth quarter of 2021 and just 181, or less than a third, two years ago.
Meanwhile, major home-ownership expenses on typical homes are unaffordable to average local wage earners during the fourth quarter of 2022 in 427, or about three-quarters, of the 581 counties in the report, based on the 28-percent lending guideline. Counties with the largest populations that are unaffordable in the fourth quarter are Los Angeles County, CA; Maricopa County (Phoenix), AZ; San Diego County, CA; Orange County, CA (outside Los Angeles) and Kings County (Brooklyn), NY.
The most populous of the 181 counties where major expenses on median-priced homes remain affordable for average local workers in the fourth quarter of 2022 are Cook County (Chicago), IL; Harris County (Houston), TX; Wayne County (Detroit), MI; Philadelphia County, PA, and Cuyahoga County (Cleveland), OH.
Interest rates have more than doubled this year to almost 7 percent, inflation remains near 40-year highs and the stock market has declined. All those forces have helped drive down prices after a decade of gains. At this point, prices haven't declined enough to make up for rising mortgage costs. But affordability could shift back in favor of home seekers if mortgage rate hikes ease or if prices drop further.
"There is a scenario where affordability improves as we move through 2023," Sharga added. "Wage growth continues to be strong; home prices appear to have stabilized and are even going down slightly; and mortgage rates may have peaked for this cycle, and could go down gradually next year. If those conditions remain in place, the affordability picture is much brighter for a lot of potential buyers."
Home prices remain up at least 5 percent annually in two-thirds of U.S. but dip quarterly in most
Despite the recent decline in the U.S. housing market, median single-family home and condo prices in the fourth quarter of 2022 remain up by at least 5 percent over the fourth quarter of 2021 in 361, or 63 percent, of the 581 counties included in the report. However, typical values have dropped from the third to the fourth quarter in 463, or 80 percent, of those counties. That has contributed to a nationwide 3 percent decrease in the median home price, from $335,000 in the third quarter of 2022 to $325,000 in the fourth quarter. The median is now down 6.9 percent from the peak of $349,000 in the second quarter of this year.
Data was analyzed for counties with a population of at least 100,000 and at least 50 single-family home and condo sales in the fourth quarter of 2022.
Among the 48 counties in the report with a population of at least 1 million, the biggest year-over-year gains in median sales prices during the fourth quarter of 2022 are in Collin County (Plano), TX (up 34 percent); Hillsborough County (Tampa), FL (up 18 percent); Miami-Dade County, FL (up 17 percent); St. Louis County, MO (up 16 percent) and Palm Beach County (West Palm Beach), FL (up 16 percent).
Counties with a population of at least 1 million where median prices have dropped most, year-over-year, during the fourth quarter of 2022 are Philadelphia County, PA (down 13 percent); New York County (Manhattan), NY (down 4 percent); Honolulu County, HI (down 4 percent); Bronx County, NY (down 1 percent) and Santa Clara County (San Jose), CA (down 1 percent).
Annual price gains still outpacing wage growth in majority of markets
Annual home-price appreciation has surpassed weekly annualized wage growth in the fourth quarter of 2022 in 327 of the 581 counties analyzed in the report (56 percent). But that was down from 84 percent of counties analyzed in the third quarter of this year. The latest group where price gains are outpacing wage gains includes Kings County (Brooklyn), NY; Miami-Dade County, FL; Dallas County, TX; Queens County, NY, and Clark County (Las Vegas), NV.
Average annualized wage growth has surpassed year-over-year home-price appreciation in the fourth quarter of 2022 in 254 of the counties in the report (44 percent). That was up from 16 percent of counties analyzed in the third quarter of this year. The latest group where wages are going up faster than prices include Los Angeles County, CA; Cook County, (Chicago), IL; Harris County (Houston), TX; Maricopa County (Phoenix), AZ, and San Diego County, CA.
Portion of wages needed for home ownership increases throughout the U.S., with 28-percent benchmark exceeded in three-quarters of the nation
With mortgage rates rising close to 7 percent, the portion of average local wages consumed by major expenses on median-priced, single-family homes and condos has increased from the third to the fourth quarter of 2022 in 97 percent of the 581 counties analyzed, helping to drive up the expense-to-wage ratio nationwide. The amount needed now tops the 28-percent lending guideline in 427, or about three-quarters of those counties, assuming a 20 percent down payment. That is up from 388, or two-thirds, of the same group of counties in the third quarter of 2022, and from 246, or less than half, in the fourth quarter of last year.
Counties with the largest quarterly increase in the portion of average local wages needed for major ownership expenses are Santa Cruz County, CA (up from 105.3 percent in the third quarter of 2022 to 124.7 percent in the fourth quarter of 2022); Maui County, HI (up from 89.5 percent to 104.3 percent); Beaufort County (Hilton Head), SC (up from 54.2 percent to 68 9 percent); Gallatin County (Bozeman), MT (up from 54.5 percent to 67.3 percent) and Alexandria City County, VA (outside Washington, DC) (up from 42.8 percent to 55.2 percent).
Those that require the largest percentage of wages are Santa Cruz County, CA (124.7 percent of annualized weekly wages needed to buy a single-family home); Kings County (Brooklyn), NY (114.6 percent); Marin County, CA (outside San Francisco) (109.6 percent); Maui County, HI (104.3 percent) and San Luis Obispo, CA (outside Bakersfield) (94.2 percent).
Aside from Kings County, NY, counties with a population of at least 1 million where major ownership expenses typically consume more than 28 percent of average local wages in the fourth quarter of 2022 include Queens County, NY (82.7 percent); Orange County, CA (outside Los Angeles) (82 percent); Alameda County (Oakland), CA (74.8 percent) and Nassau County (Long Island), NY (72 percent).
Counties where the smallest portion of average local wages are required to afford the median-priced home during the fourth quarter of this year are Macon County (Decatur), IL (12 percent of annualized weekly wages needed to buy a home); Schuylkill County, PA (outside Allentown) (12.8 percent); Peoria County, IL (13.5 percent); St. Lawrence County, NY (north of Syracuse) (13.6 percent) and Cambria County, PA (east of Pittsburgh (14.1 percent).
Counties with a population of at least 1 million where major ownership expenses typically consume less than 28 percent of average local wages in the fourth quarter of 2022 include Wayne County, (Detroit), MI (16.9 percent); Philadelphia County, PA (18.2 percent); Cuyahoga County (Cleveland), OH (19.7 percent); Allegheny County (Pittsburgh), PA (20.7 percent) and St. Louis County, MO (24.1 percent).
Annual wages of more than $75,000 needed to afford typical home in half of markets
With affordability declining, annual wages of more than $75,000 are needed to pay for major costs on the median-priced home purchased during the fourth quarter of 2022 in 291, or 50 percent, of the 581 markets in the report.
The top 25 highest annual wages required to afford typical homes again are on the east or west coast, led by San Mateo County (outside San Francisco), CA ($367,563); New York County (Manhattan), NY ($364,861); Marin County (outside San Francisco), CA ($349,140); San Francisco County, CA ($327,634) and Santa Clara County (San Jose), CA ($322,775).
The lowest annual wages required to afford a median-priced home in the fourth quarter of 2022 are in Cambria County, PA (east of Pittsburgh) ($22,502); Schuylkill County, PA (outside Allentown) ($22,974); St. Lawrence County, NY (north of Syracuse) ($26,714); Macon County (Decatur), IL ($26,788) and Bibb County (Macon), GA ($27,332).
Historic affordability continues downward, dropping in nearly all counties
Among the 581 counties analyzed, 99 percent are less affordable in the fourth quarter of 2022 than their historic affordability averages. That is virtually the same as the 98 percent level in the third quarter of 2022, but is up from 68 percent of the same counties a year ago. Historic indexes worsened in 97 percent of those counties, helping to drive the nationwide index down to its lowest point since the second quarter of 2007, just before an economic contraction known as the Great Recession hit.
Counties with a population of at least 1 million that are less affordable than their historic averages (indexes of less than 100 are considered less affordable compared to historic averages) include Collin County (Plano), TX (index of 50); Hillsborough County (Tampa), FL (55); Wayne County (Detroit), MI (55); Mecklenburg County (Charlotte), NC (56) and Maricopa County (Phoenix), AZ (56).
Counties with the worst affordability indexes in the fourth quarter of 2022 are Rankin County (outside Jackson), MS (index of 44); Clayton County, GA (outside Atlanta) (45); Jackson County, MS (outside Mobile, AL) (48); Benton County (Kennewick), WA (48) and Newton County, GA (outside Atlanta) (49).
Among counties with a population of at least 1 million, those where the affordability indexes have declined most from the third quarter of 2022 to the fourth quarter of 2022 are Collin County (Plano), TX (index down 20 percent); St. Louis County, MO (down 13 percent); Miami-Dade County, FL (down 12 percent); Alameda County (Oakland), CA (down 12 percent) and Fulton County (Atlanta), GA (down 11 percent).
Report Methodology
The ATTOM U.S. Home Affordability Index analyzed median home prices derived from publicly recorded sales deed data collected by ATTOM and average wage data from the U.S. Bureau of Labor Statistics in 581 U.S. counties with a combined population of 257.8 million during the fourth quarter of 2022. The affordability index is based on the percentage of average wages needed to pay for major expenses on a median-priced home with a 30-year fixed-rate mortgage and a 20 percent down payment. Those expenses include property taxes, home insurance, mortgage payments and mortgage insurance. Average 30-year fixed interest rates from the Freddie Mac Primary Mortgage Market Survey were used to calculate monthly house payments.
The report determined affordability for average wage earners by calculating the amount of income needed for major home ownership expenses on a median-priced home, assuming a loan of 80 percent of the purchase price and a 28 percent maximum "front-end" debt-to-income ratio. For example, the nationwide median home price of $325,000 in the fourth quarter of 2022 requires an annual wage of $80,142. That is based on a $65,000 down payment, a $260,000 loan and monthly expenses not exceeding the 28 percent barrier — meaning wage earners would not be spending more than 28 percent of their pay on mortgage payments, property taxes and insurance. That required income is more than the $69,381 average wage nationwide, based on the most recent average weekly wage data available from the Bureau of Labor Statistics, making a median-priced home nationwide unaffordable for average workers.
About ATTOM
ATTOM provides premium property data to power products that improve transparency, innovation, efficiency and disruption in a data-driven economy. ATTOM multi-sources property tax, deed, mortgage, foreclosure, environmental risk, natural hazard, and neighborhood data for more than 155 million U.S. residential and commercial properties covering 99 percent of the nation's population. A rigorous data management process involving more than 20 steps validates, standardizes, and enhances the real estate data collected by ATTOM, assigning each property record with a persistent, unique ID — the ATTOM ID. The 30TB ATTOM Data Warehouse fuels innovation in many industries including mortgage, real estate, insurance, marketing, government and more through flexible data delivery solutions that include bulk file licenses, property data APIs, real estate market trends, property reports and more. Also, introducing our newest innovative solution, that offers immediate access and streamlines data management – ATTOM Cloud.