
RETECHNOLOGY PREMIUM MARKETPLACE RELATED PRODUCTS | WEBINARS | SPECIAL OFFERS


You are viewing our site as an Agent, Switch Your View:
Agent | Broker Reset Filters to Default Back to ListNational Home Price Gains Continue to Exceed 20% in May
July 05 2022
IRVINE, Calif., July 5, 2022 -- CoreLogic, a leading global property information, analytics and data-enabled solutions provider, today released the CoreLogic Home Price Index (HPI) and HPI Forecast for May 2022.
Though U.S. home price growth relaxed slightly in May from April, it remained in double digits year over year for the 16th consecutive month. As in past months, all states and Washington, D.C. posted annual appreciation, with 13 states posting gains of more than 20%. While rising interest rates cooled overheated demand this spring and are expected to contribute to slowing price growth over the next year, motivated buyers may have less competition and more opportunities moving forward.
"Slowing home price growth reflects the dampening consequence of higher mortgage rates on housing demand, which was the intention," said Selma Hepp, deputy chief economist at CoreLogic. "With monthly mortgage expenses up about 50% from only a few months ago, fewer buyers are now competing for continually limited inventory. And while annual home price growth still exceeds 20%, we expect to see a rapid deceleration in the rate of growth over the coming year. Nevertheless, the normalization of overheated buying conditions should bring about more of a balance between buyers and sellers and a healthier overall housing market."
Top Takeaways:
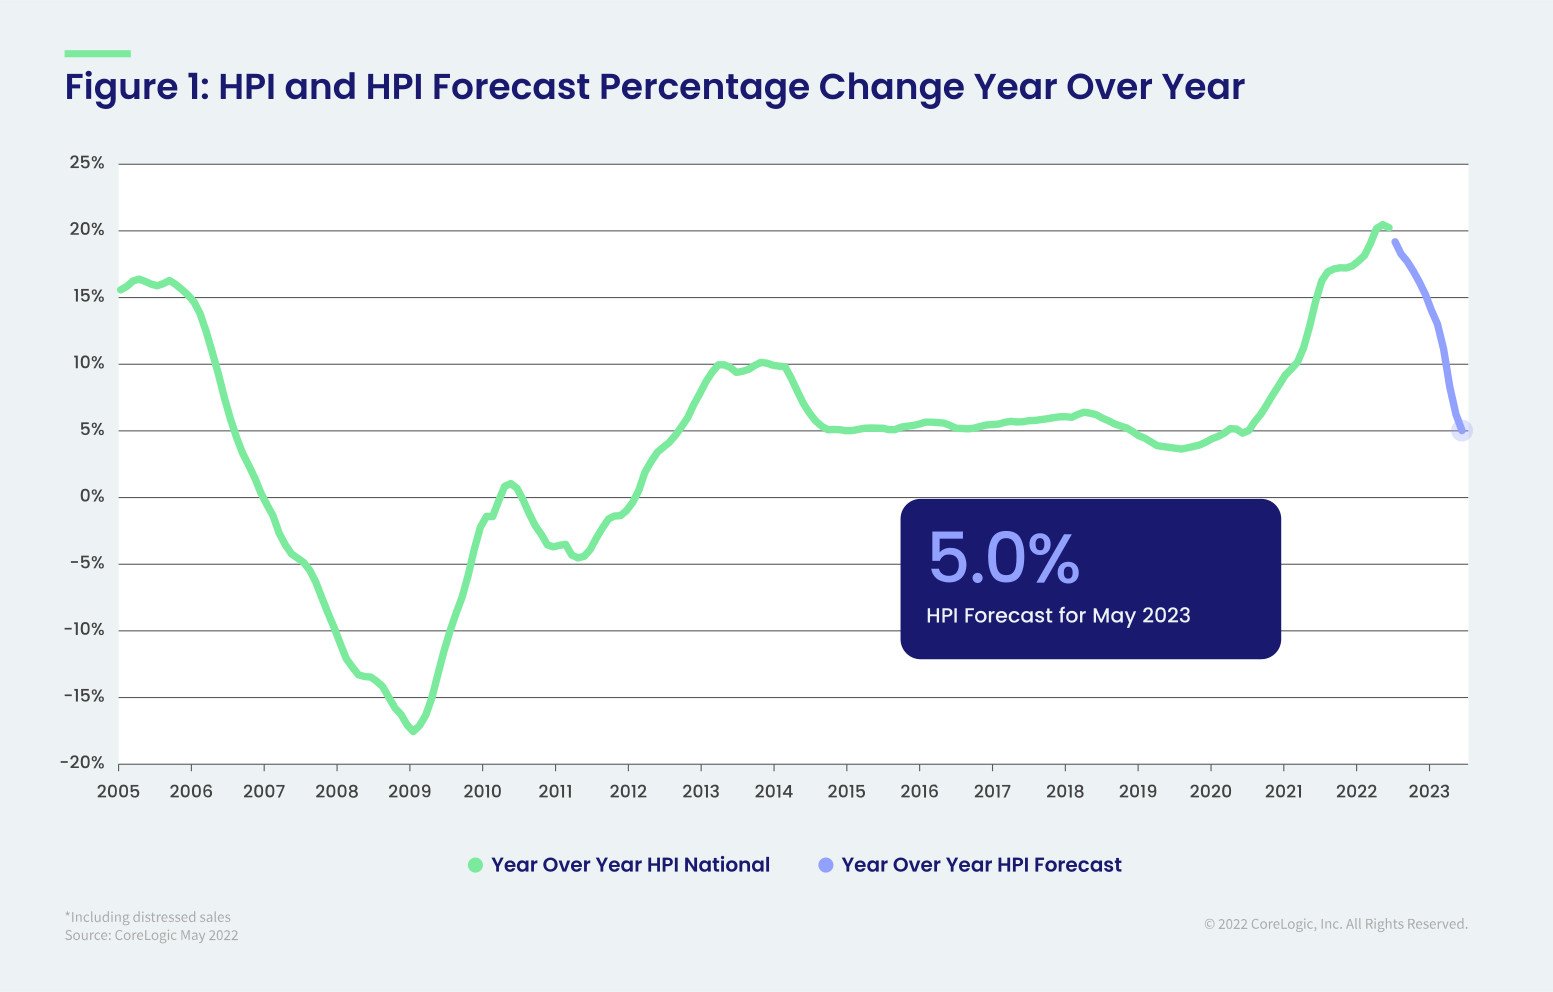
- U.S. home prices (including distressed sales) increased 20.2% in May 2022, compared to May 2021. On a month-over-month basis, home prices increased by 1.8% compared to April 2022.
- In May, annual appreciation of detached properties (20.9%) was 2.9 percentage points higher than that of attached properties (18%).
- Annual U.S. home price gains are forecast to slow to 5% by May 2023 as rising mortgage rates and affordability challenges are expected to cool buyer demand.
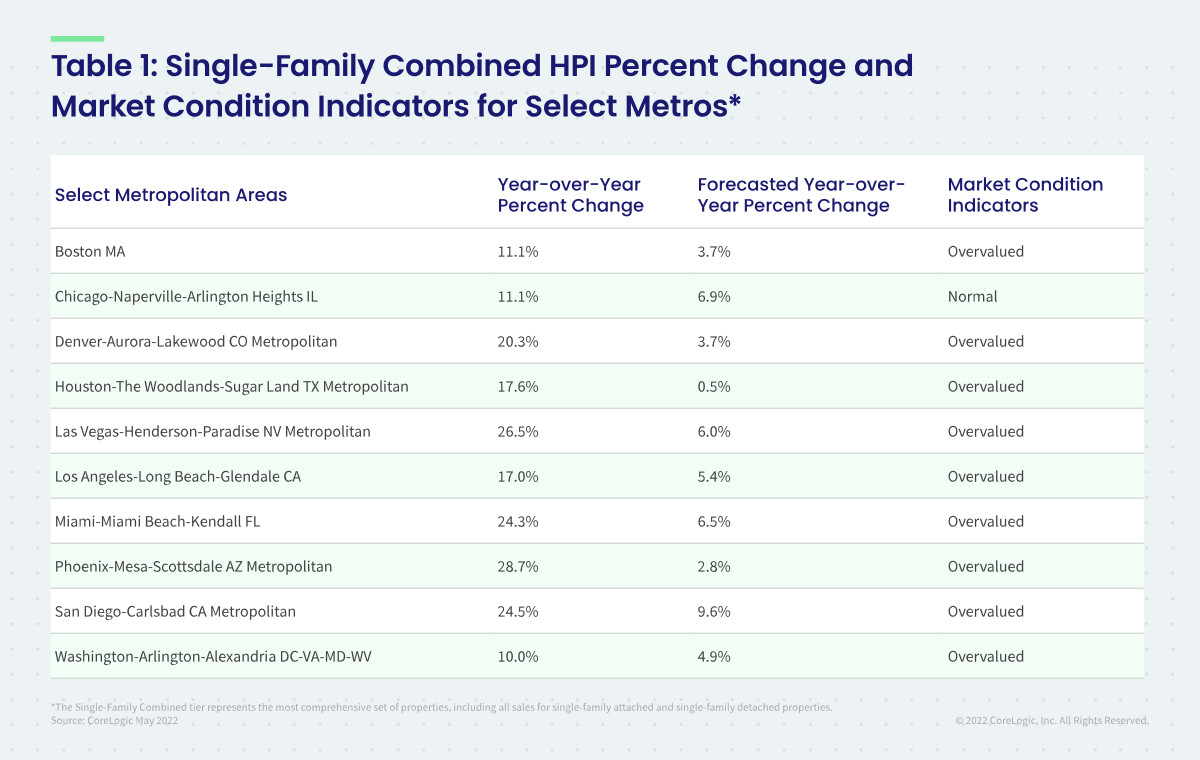
- Tampa, Florida logged the highest year-over-year home price increase of the country's 20 largest metro areas in May, at 33.4%, while Phoenix posted the second-largest hike, at 28.7%. These two metros also registered the largest gains in March and April.
- Florida and Tennessee posted the highest home price gains, a respective 33.2% and 27.4%. Arizona ranked third with a 27.3% year-over-year increase. Washington, D.C. ranked last for appreciation at 4.3%, but CoreLogic forecasts that the rate of price growth there will rise slightly by May 2023.
Methodology
The CoreLogic HPI™ is built on industry-leading public record, servicing and securities real-estate databases and incorporates more than 45 years of repeat-sales transactions for analyzing home price trends. Generally released on the first Tuesday of each month with an average five-week lag, the CoreLogic HPI is designed to provide an early indication of home price trends by market segment and for the "Single-Family Combined" tier, representing the most comprehensive set of properties, including all sales for single-family attached and single-family detached properties. The indices are fully revised with each release and employ techniques to signal turning points sooner. The CoreLogic HPI provides measures for multiple market segments, referred to as tiers, based on property type, price, time between sales, loan type (conforming vs. non-conforming) and distressed sales. Broad national coverage is available from the national level down to ZIP Code, including non-disclosure states.
CoreLogic HPI Forecasts™ are based on a two-stage, error-correction econometric model that combines the equilibrium home price—as a function of real disposable income per capita—with short-run fluctuations caused by market momentum, mean-reversion, and exogenous economic shocks like changes in the unemployment rate. With a 30-year forecast horizon, CoreLogic HPI Forecasts project CoreLogic HPI levels for two tiers — "Single-Family Combined" (both attached and detached) and "Single-Family Combined Excluding Distressed Sales." As a companion to the CoreLogic HPI Forecasts, Stress-Testing Scenarios align with Comprehensive Capital Analysis and Review (CCAR) national scenarios to project five years of home prices under baseline, adverse and severely adverse scenarios at state, metropolitan areas and ZIP Code levels. The forecast accuracy represents a 95% statistical confidence interval with a +/- 2% margin of error for the index.
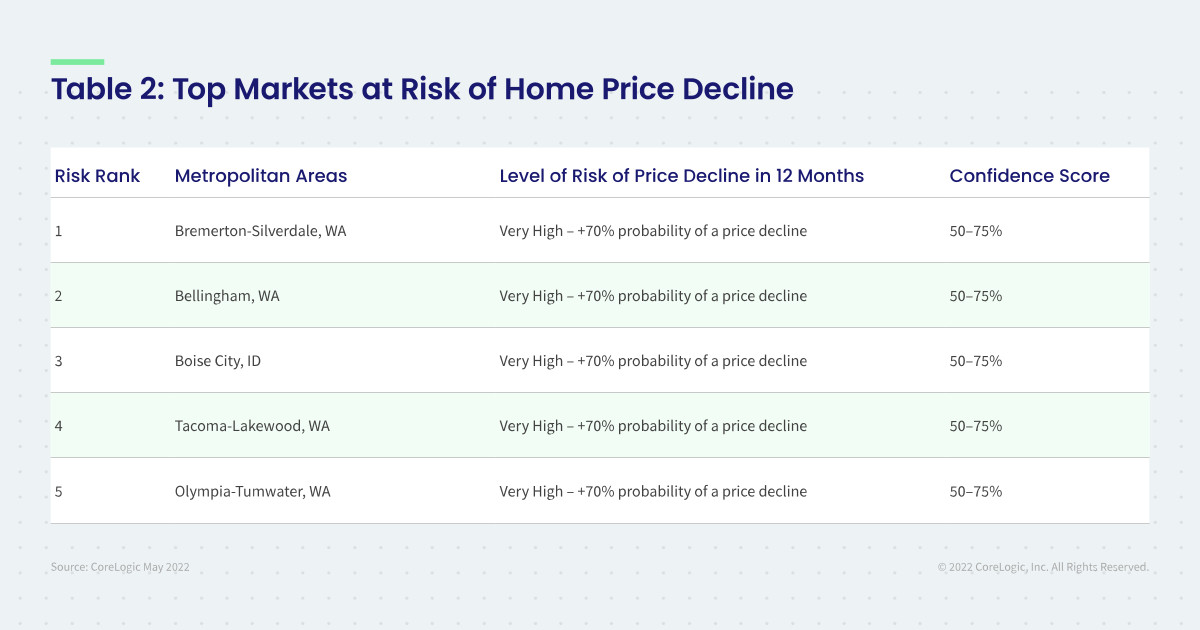
About Market Risk Indicator
Market Risk Indicators are a subscription-based analytics solution that provide monthly updates on the overall "health" of housing markets across the country. CoreLogic data scientists combine world-class analytics with detailed economic and housing data to help determine the likelihood of a housing bubble burst in 392 major metros and all 50 states. Market Risk Indicators is a multi-phase regression model that provides a probability score (from 1 to 100) on the likelihood of two scenarios per metro: a >10% price reduction and a ≤ 10% price reduction. The higher the score, the higher the risk of a price reduction.
About the Market Condition Indicators
As part of the CoreLogic HPI and HPI Forecasts offerings, Market Condition Indicators are available for all metropolitan areas and identify individual markets as "overvalued", "at value", or "undervalued." These indicators are derived from the long-term fundamental values, which are a function of real disposable income per capita. Markets are labeled as overvalued if the current home price indexes exceed their long-term values by greater than 10%, and undervalued where the long-term values exceed the index levels by greater than 10%.
Source: CoreLogic
The data provided are for use only by the primary recipient or the primary recipient's publication or broadcast. This data may not be resold, republished or licensed to any other source, including publications and sources owned by the primary recipient's parent company without prior written permission from CoreLogic. Any CoreLogic data used for publication or broadcast, in whole or in part, must be sourced as coming from CoreLogic, a data and analytics company. For use with broadcast or web content, the citation must directly accompany first reference of the data. If the data are illustrated with maps, charts, graphs or other visual elements, the CoreLogic logo must be included on screen or website. For questions, analysis or interpretation of the data, contact Robin Wachner at [email protected]. Data provided may not be modified without the prior written permission of CoreLogic. Do not use the data in any unlawful manner. The data are compiled from public records, contributory databases and proprietary analytics, and its accuracy is dependent upon these sources.
About CoreLogic
CoreLogic is a leading global property information, analytics and data-enabled solutions provider. The company's combined data from public, contributory and proprietary sources includes over 4.5 billion records spanning more than 50 years, providing detailed coverage of property, mortgages and other encumbrances, consumer credit, tenancy, location, hazard risk and related performance information. The markets CoreLogic serves include real estate and mortgage finance, insurance, capital markets, and the public sector. CoreLogic delivers value to clients through unique data, analytics, workflow technology, advisory and managed services. Clients rely on CoreLogic to help identify and manage growth opportunities, improve performance and mitigate risk. Headquartered in Irvine, Calif., CoreLogic operates in North America, Western Europe and Asia Pacific. For more information, please visit www.corelogic.com.