
RETECHNOLOGY PREMIUM MARKETPLACE RELATED PRODUCTS | WEBINARS | SPECIAL OFFERS


You are viewing our site as an Agent, Switch Your View:
Agent | Broker Reset Filters to Default Back to ListCoreLogic Reports Upward Trend in Annual Home Price Appreciation Continues; Up 18.5% in December
February 02 2022
Home price gains averaged 15% in 2021, up from 6% in 2020
IRVINE, Calif., February 1, 2022 -- CoreLogic, a leading global property information, analytics and data-enabled solutions provider, today released the CoreLogic Home Price Index (HPI) and HPI Forecast for December 2021.
Consumer desire for homeownership against persistently low supply of for-sale homes created one of the hottest housing markets in decades in 2021 — and spurred record-breaking home price growth. Price appreciation averaged 15% for the full year of 2021, up from the 2020 full year average of 6%. Home price growth in 2021 started off at 10% in the first quarter, steadily increasing and ending the year with an increase of 18% for the fourth quarter.
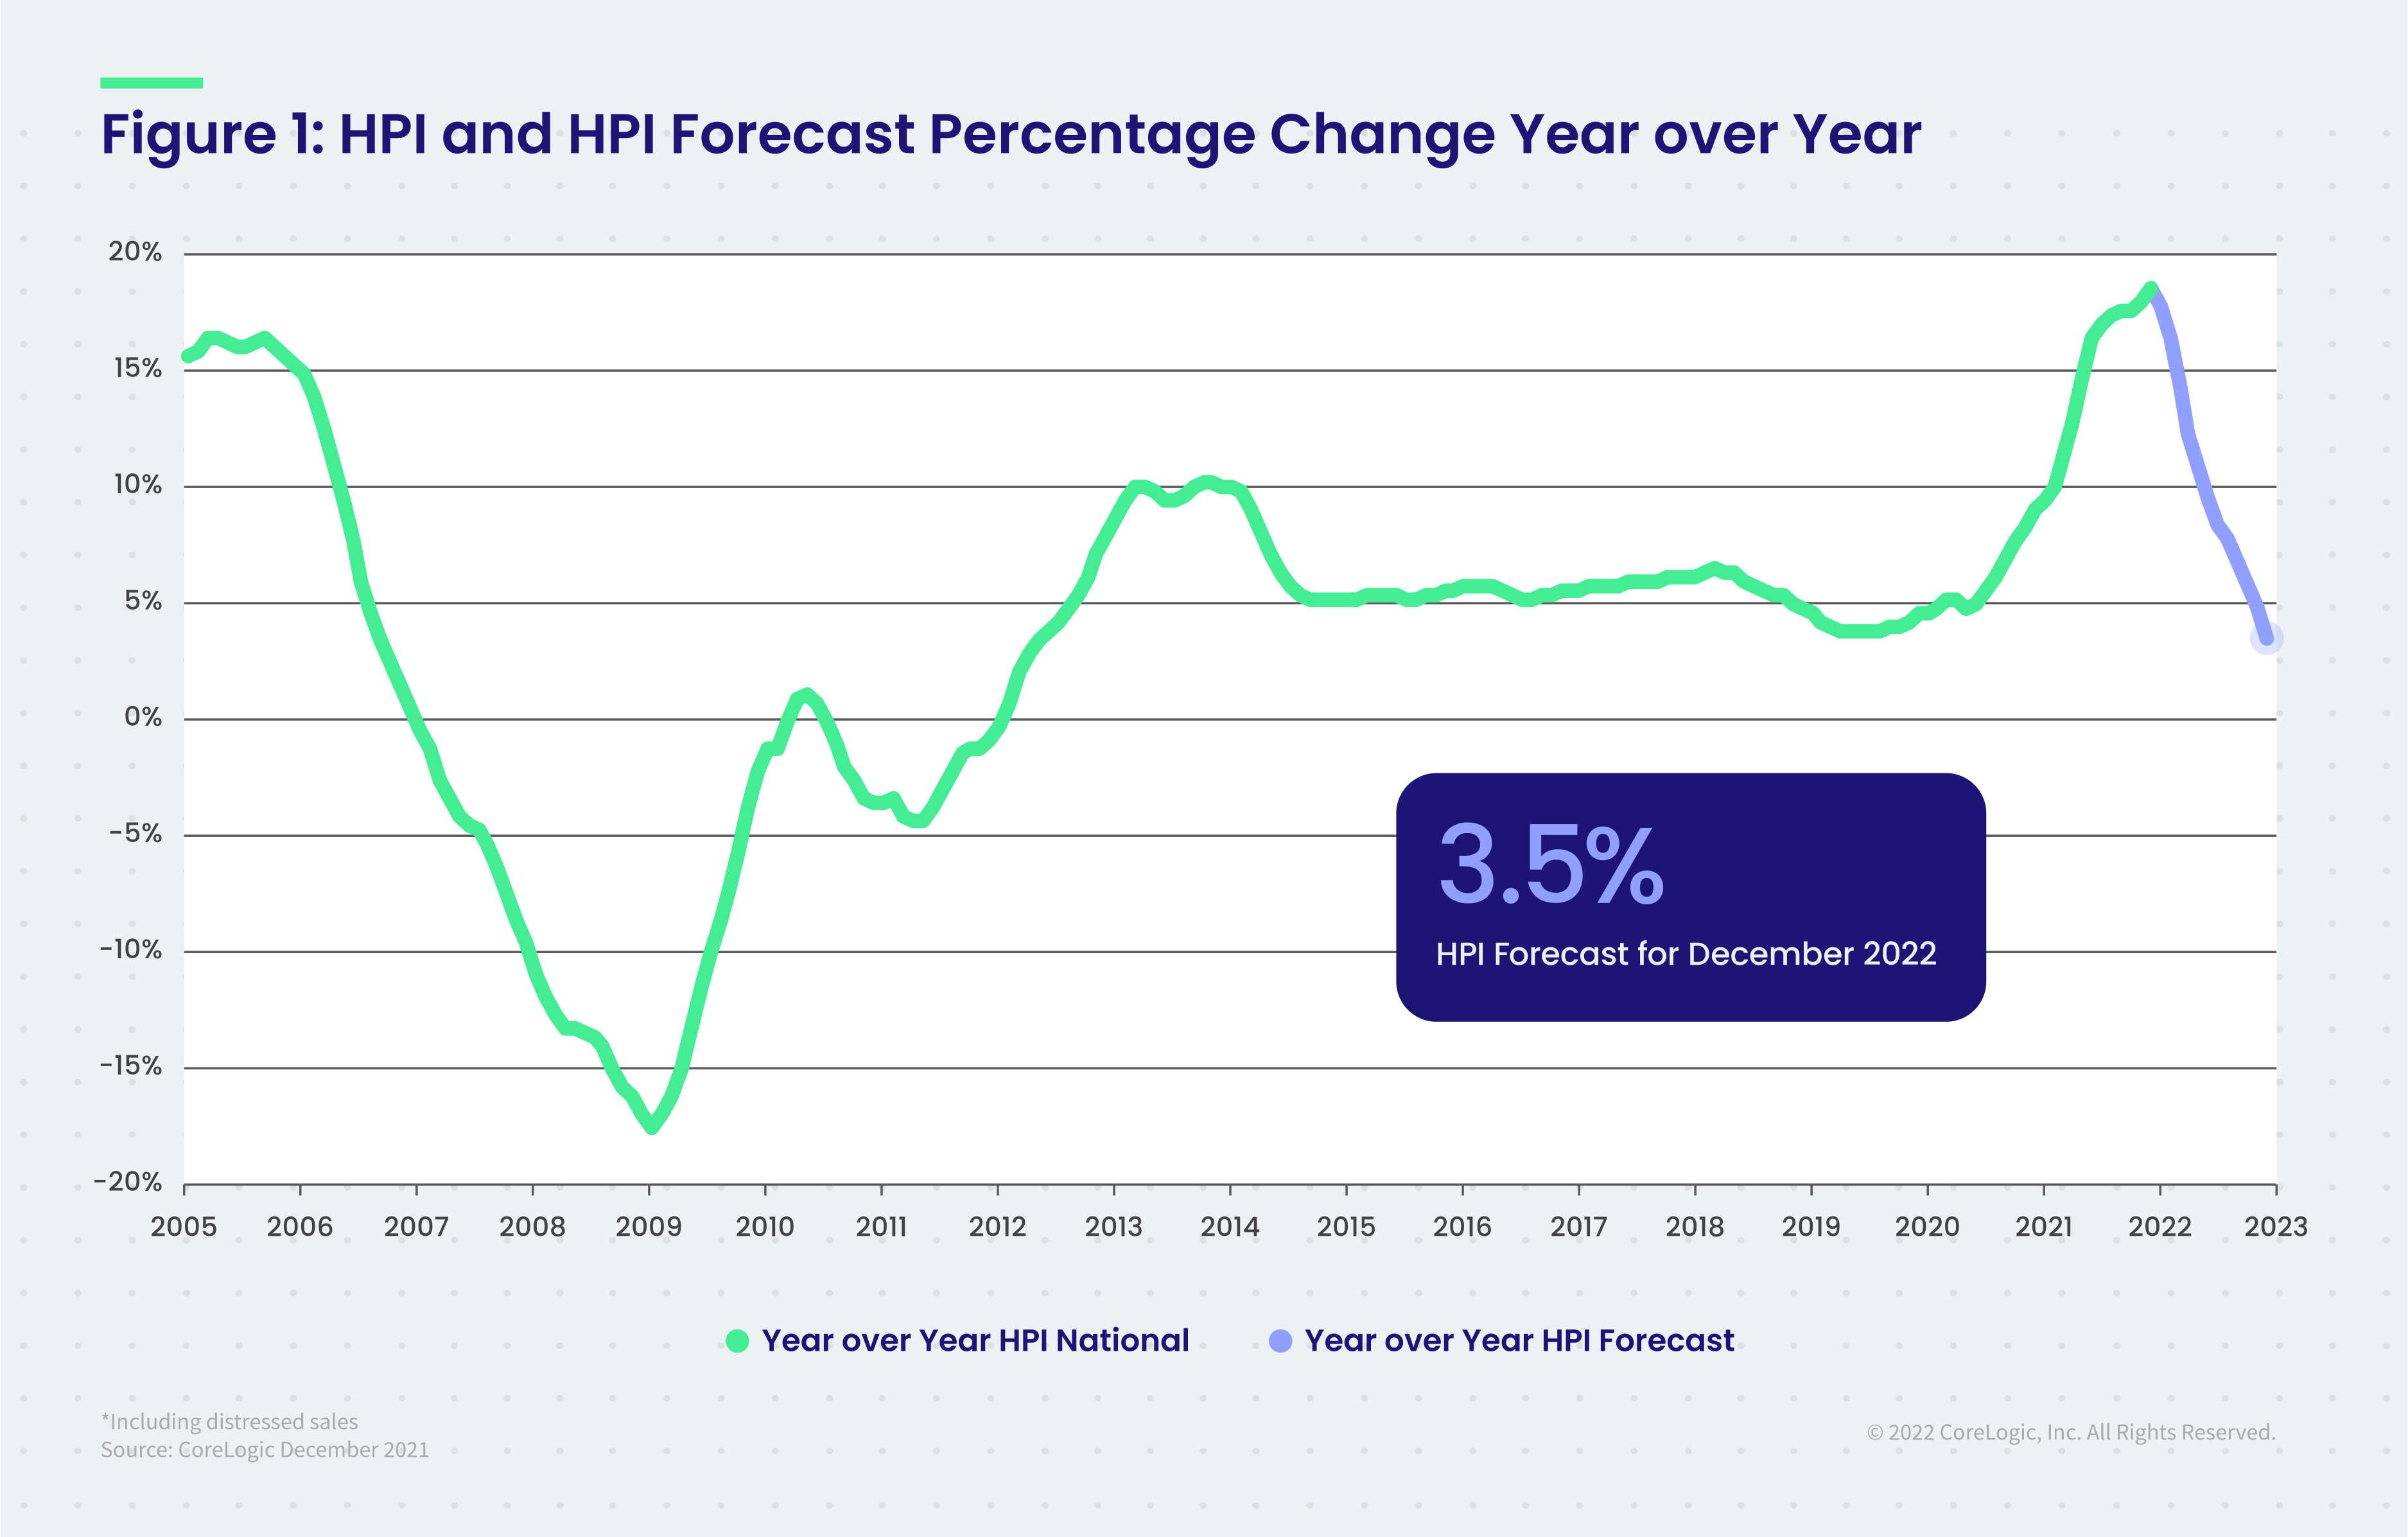
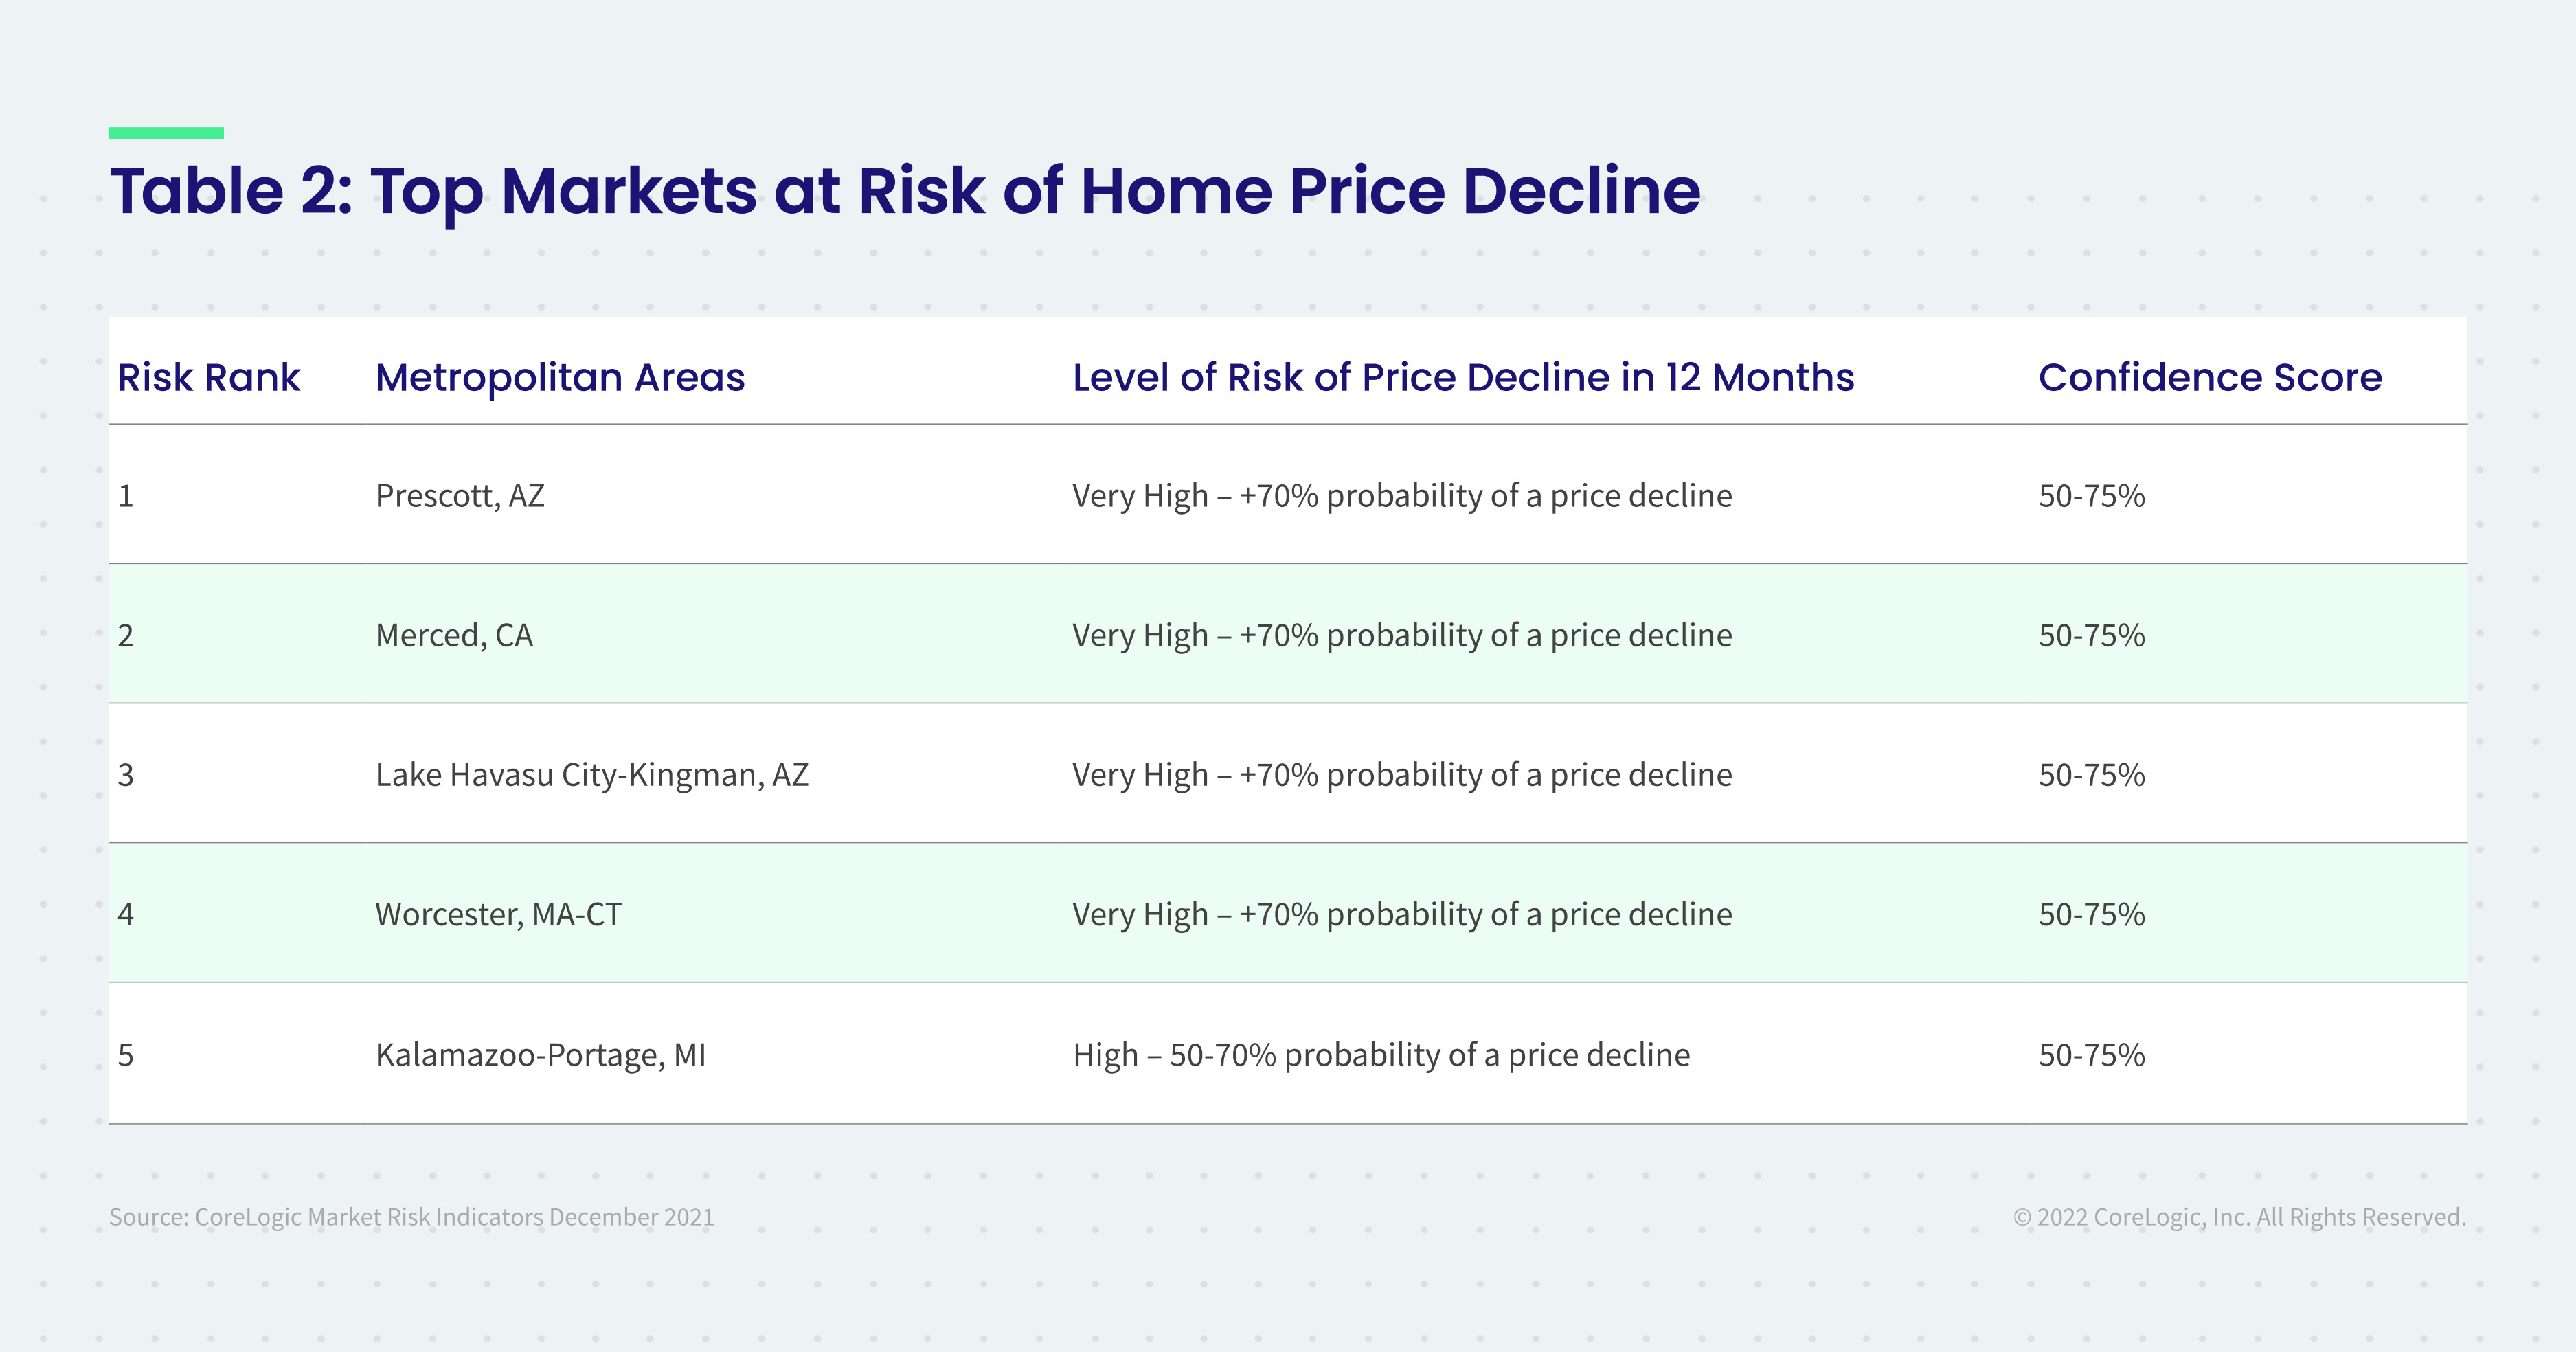
While there have been questions surrounding whether we are currently in a housing bubble, the CoreLogic Market Risk Indicators suggest a small probability of a nationwide price decline, and points to the larger likelihood that a fall in price will be limited to specific, at-risk markets (Table 2). Still, the CoreLogic HPI Forecast shows the national 12-month growth steadily slowing over 2022. During the early months of the year, it's projected to remain above 10% while decelerating each month to a 12-month rise of 3.5% by December 2022. Comparing the average projected National HPI for 2022 with the previous year, the CoreLogic HPI Forecast shows the annual average up 9.6% in 2022.
"Much of what we've seen in the run-up of home prices over the last year has been the result of a perfect storm of supply and demand pressures," said Dr. Frank Nothaft, chief economist at CoreLogic. "As we move further into 2022, economic factors – such as new home building and a rise in mortgage rates – are in motion to help relieve some of this pressure and steadily temper the rapid home price acceleration seen in 2021."
Top Takeaways:
- Nationally, home prices increased 18.5% in December 2021, compared to December 2020. On a month-over-month basis, home prices increased by 1.3% compared to November 2021.
- In December, annual appreciation of detached properties (19.7%) was 5.5 percentage points higher than that of attached properties (14.2%).
- Home price gains are projected to slow to a 3.5% annual increase by December 2022.
- In December, Naples, Florida, logged the highest year-over-year home price increase at 37.6%. Punta Gorda, Florida, had the second-highest ranking at 35.7%.
- At the state level, the Southern, Southwest and Mountain West regions continued to dominate the top three spots for national home price growth, with Arizona leading the way at 28.4%.
- Florida ranked second with a 27.1% growth and Utah followed in third place at 25.2%.
Methodology
The CoreLogic HPI™ is built on industry-leading public record, servicing and securities real-estate databases and incorporates more than 45 years of repeat-sales transactions for analyzing home price trends. Generally released on the first Tuesday of each month with an average five-week lag, the CoreLogic HPI is designed to provide an early indication of home price trends by market segment and for the "Single-Family Combined" tier, representing the most comprehensive set of properties, including all sales for single-family attached and single-family detached properties. The indices are fully revised with each release and employ techniques to signal turning points sooner. The CoreLogic HPI provides measures for multiple market segments, referred to as tiers, based on property type, price, time between sales, loan type (conforming vs. non-conforming) and distressed sales. Broad national coverage is available from the national level down to ZIP Code, including non-disclosure states.
CoreLogic HPI Forecasts™ are based on a two-stage, error-correction econometric model that combines the equilibrium home price—as a function of real disposable income per capita—with short-run fluctuations caused by market momentum, mean-reversion, and exogenous economic shocks like changes in the unemployment rate. With a 30-year forecast horizon, CoreLogic HPI Forecasts project CoreLogic HPI levels for two tiers — "Single-Family Combined" (both attached and detached) and "Single-Family Combined Excluding Distressed Sales." As a companion to the CoreLogic HPI Forecasts, Stress-Testing Scenarios align with Comprehensive Capital Analysis and Review (CCAR) national scenarios to project five years of home prices under baseline, adverse and severely adverse scenarios at state, metropolitan areas and ZIP Code levels. The forecast accuracy represents a 95% statistical confidence interval with a +/- 2% margin of error for the index.
About Market Risk Indicator
Market Risk Indicators are a subscription-based analytics solution that provide monthly updates on the overall "health" of housing markets across the country. CoreLogic data scientists combine world-class analytics with detailed economic and housing data to help determine the likelihood of a housing bubble burst in 392 major metros and all 50 states. Market Risk Indicators is a multi-phase regression model that provides a probability score (from 1 to 100) on the likelihood of two scenarios per metro: a >10% price reduction and a ≤ 10% price reduction. The higher the score, the higher the risk of a price reduction.
About the Market Condition Indicators
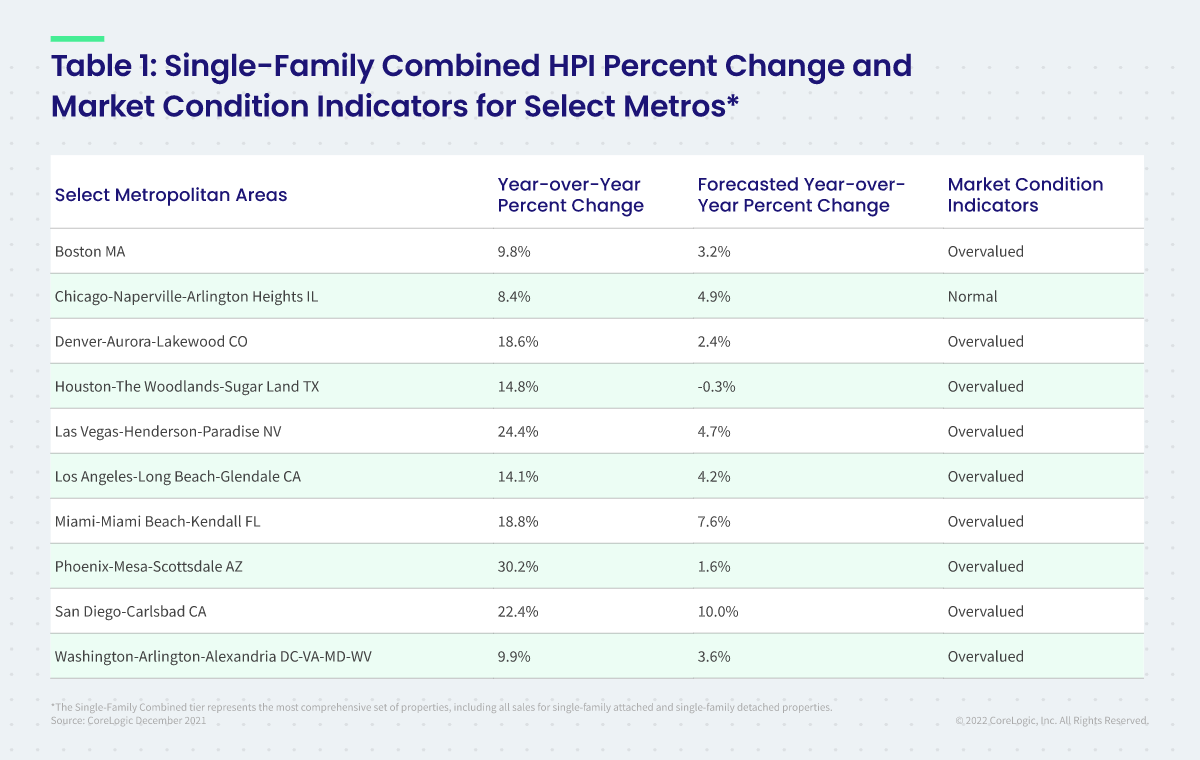
As part of the CoreLogic HPI and HPI Forecasts offerings, Market Condition Indicators are available for all metropolitan areas and identify individual markets as "overvalued", "at value", or "undervalued." These indicators are derived from the long-term fundamental values, which are a function of real disposable income per capita. Markets are labeled as overvalued if the current home price indexes exceed their long-term values by greater than 10%, and undervalued where the long-term values exceed the index levels by greater than 10%.
About CoreLogic
CoreLogic is a leading global property information, analytics and data-enabled solutions provider. The company's combined data from public, contributory and proprietary sources includes over 4.5 billion records spanning more than 50 years, providing detailed coverage of property, mortgages and other encumbrances, consumer credit, tenancy, location, hazard risk and related performance information. The markets CoreLogic serves include real estate and mortgage finance, insurance, capital markets, and the public sector. CoreLogic delivers value to clients through unique data, analytics, workflow technology, advisory and managed services. Clients rely on CoreLogic to help identify and manage growth opportunities, improve performance and mitigate risk. Headquartered in Irvine, Calif., CoreLogic operates in North America, Western Europe and Asia Pacific. For more information, please visit www.corelogic.com.