
RETECHNOLOGY PREMIUM MARKETPLACE RELATED PRODUCTS | WEBINARS | SPECIAL OFFERS


You are viewing our site as an Agent, Switch Your View:
Agent | Broker Reset Filters to Default Back to ListKey Housing Indicators Begin to Turn Around in May
June 07 2020
Data shows new listings and asking price trends strengthen after bottoming out in April
SANTA CLARA, Calif., June 4, 2020 -- The U.S. housing market likely reached its low point during mid-April with constrained new inventory and minimal price growth. Signs of recovery emerged in late April and strengthened in May, setting the stage for continued growth over the summer, according to realtor.com®'s May Monthly Housing Trends report issued today.
The data show the national median listing price hit a new all-time high of $330,000 in May, despite rising just 1.6 percent year-over-year. This price growth was an improvement over April's 0.6 percent year-over-year growth which was the slowest pace in the past three years. Additionally, the weekly progression of data showed that price growth and new inventory trends improved.
The median list price began the month up 1.4 percent and strengthened throughout the month, increasing 3.1 percent during the last week of May. New listings were down 29.1 percent the week ending May 9, but recovered to down 22.9 percent by the week of May 30. While still well-below last year's levels, the rate of decline in newly listed properties has improved dramatically from a drop of 44.1 percent year-over-year in April to down 29.4 percent in May. Despite these positive trends, COVID-related challenges linger; homes were on the market 15 days longer than this time last year.
"May's home price data demonstrate the underlying strength of the U.S. housing market despite the challenges brought by the COVID-19 pandemic," said realtor.com® Chief Economist Danielle Hale. "The fact that home prices are at an all-time high shows that the momentum the market had prior to the pandemic has helped to keep buyer and seller expectations stable. Ongoing inventory shortages, that continue to worsen, also push home prices higher even while homes sell more slowly."
"As a sense of normalcy returns, we expect to see a shortened, but strong summer home selling season, as long as seller confidence continues to improve and more homes are listed for sale," Hale added.
Listing Prices Hit New High Despite COVID-19
Thirty-five of the nation's top 50 metros saw the median listing price grow on a year-over-year basis, up from 30 metros in April. Based on this trend, listing prices could reach new highs throughout the summer home buying season when prices typically see their yearly seasonal peak.
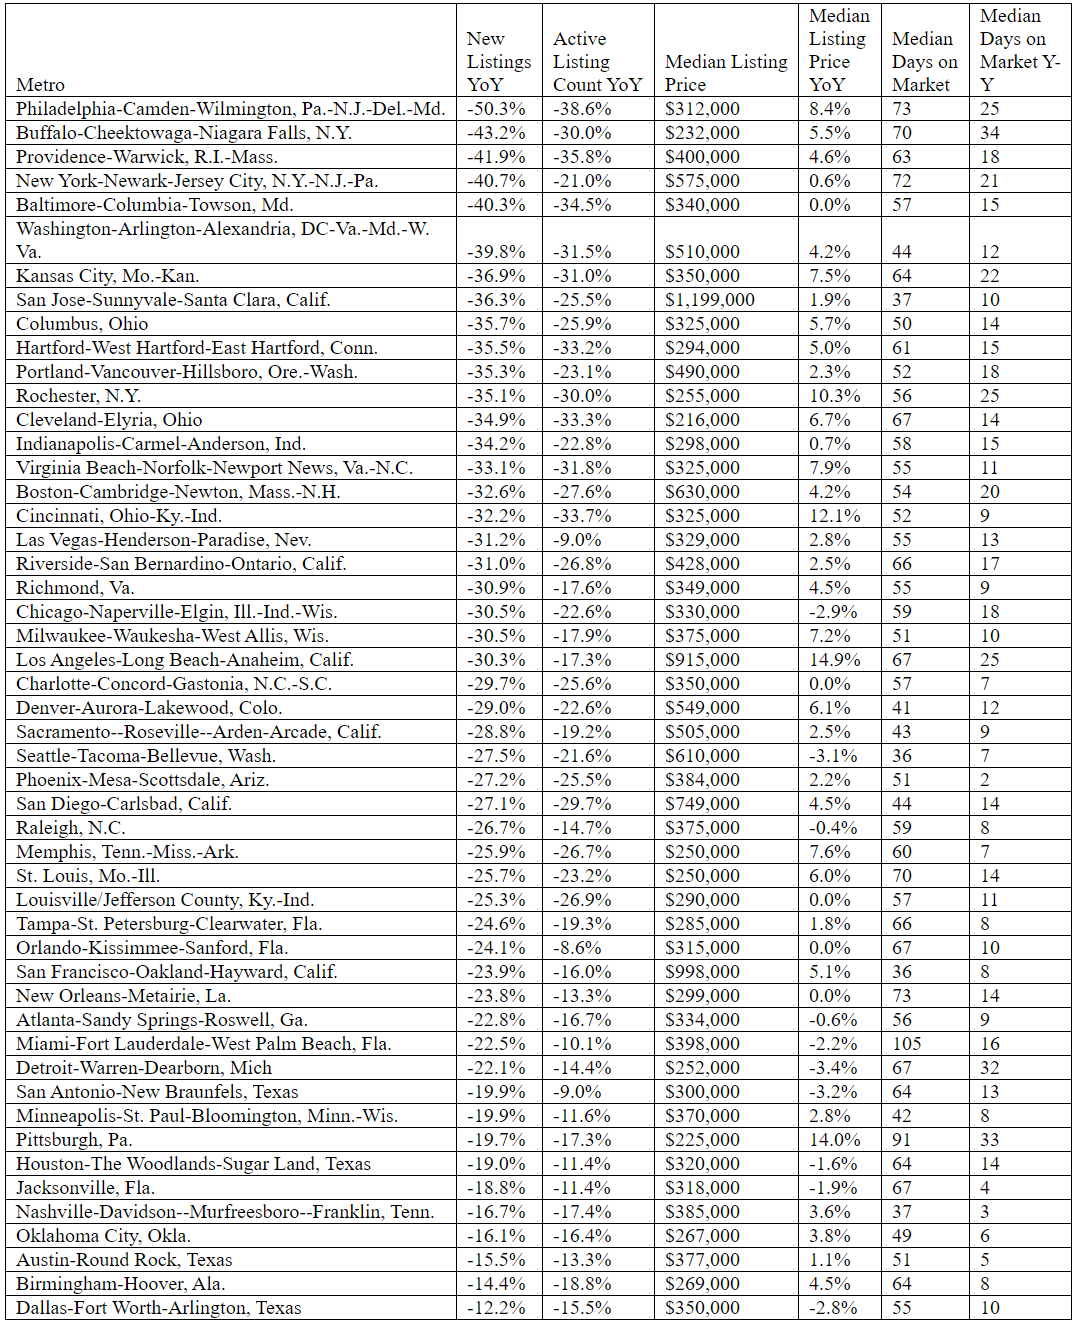
Los Angeles-Long Beach-Anaheim, Calif. (+14.9 percent), Pittsburgh, Pa. (+14.0 percent); and Cincinnati, Ohio-Ky.-Ind. (+12.1 percent); posted the highest year-over-year median list price growth in May. The steepest price declines were seen in Detroit-Warren-Dearborn, Mich. (-3.4 percent); San Antonio-New Braunfels, Texas (-3.2 percent); and Seattle-Tacoma-Bellevue, Wash. (-3.1 percent).
For-Sale Homes Still in Short Supply, but New Listings Trend Improves
National inventory continued to be constrained, down nearly 20 percent over last year, as seller reactions to COVID-19 exaggerated the housing market's already insufficient supply of homes. At the same time, the month of May ended with an improvement in the new listings trend--smaller declines--in 45 of the 50 largest U.S. markets compared to last month. This signals that sellers are starting to return to the marketplace, which is needed to restore inventory levels for healthy market conditions.
Within the nation's 50 largest metros, inventory declined by 21.9 percent year-over-year, a greater rate than April's 16 percent decline. The metros which saw the largest declines in inventory were largely those hardest hit by COVID-19 along the East Coast, including: Philadelphia-Camden-Wilmington, Pa.-N.J.-Del.-Md. (-38.6 percent); Providence-Warwick, R.I.-Mass. (-35.8 percent); and Baltimore-Columbia-Towson, Md. (-34.5 percent). This month, none of the largest 50 metros saw an inventory increase on a year-over-year basis and 43 out of the 50 saw greater yearly inventory declines than last month.
COVID-19 Extends Days on Market
Homes continue to sell more slowly than last year due to stay at home orders and modified behavior resulting from COVID-19. The typical home is now selling in 71 days, which is more than two weeks slower than last year. Within the nation's 50 largest metros, the typical home sold in 58 days, 13 days more slowly, on average, compared to last year.
Among the largest metropolitan areas, homes in areas hit hardest by COVID-19 saw the greatest increase in time spent on the market, including: Buffalo-Cheektowaga-Niagara Falls, N.Y. (+34 days); Pittsburgh, Pa. (+33 days); and Detroit-Warren-Dearborn-Mich. (+32 days).
Metros With Largest Decline in New Listings
EDITOR'S NOTE: The realtor.com economics team is continually tracking the impact of the coronavirus pandemic on the U.S. economy and housing market. The team's reports and analysis are available here.
About realtor.com®
Realtor.com® makes buying, selling and living in homes easier and more rewarding for everyone. Realtor.com® pioneered the world of digital real estate 20 years ago, and today through its website and mobile apps is a trusted source for the information, tools and professional expertise that help people move confidently through every step of their home journey. Using proprietary data science and machine learning technology, realtor.com® pairs buyers and sellers with local agents in their market, helping take the guesswork out of buying and selling a home. For professionals, realtor.com® is a trusted provider of consumer connections and branding solutions that help them succeed in today's on-demand world. Realtor.com® is operated by News Corp [Nasdaq: NWS, NWSA] [ASX: NWS, NWSLV] subsidiary Move, Inc. under a perpetual license from the National Association of REALTORS®. For more information, visit realtor.com®.