
RETECHNOLOGY PREMIUM MARKETPLACE RELATED PRODUCTS | WEBINARS | SPECIAL OFFERS


You are viewing our site as an Agent, Switch Your View:
Agent | Broker Reset Filters to Default Back to ListU.S. Housing Supply Reaches New Low
February 10 2020
Inventory continued to fall and prices rose in January setting the stage for a competitive homebuying season
SANTA CLARA, Calif., Feb. 7, 2020 -- National housing inventory declined 13.6 percent in January, the steepest year-over-year decrease in more than 4 years, pushing the supply of for sale homes in the U.S. to its lowest level since realtor.com® began tracking the data in 2012, according to the website's January Monthly Housing Trends Report released today.
Based on realtor.com®'s analysis, January's steep year-over-year decline amounted to a national loss of 164,000 listings, tightening the grip of the housing shortage plaguing the U.S. Based on realtor.com® data, it shows no signs of easing in the near future as the volume of newly listed properties also declined by 10.6 percent since last year.
"Homebuyers took advantage of low mortgage rates and stable listing prices to drive sales higher at the end of 2019, further depleting the already limited inventory of homes for sale. With fewer homes coming up for sale, we've hit another new low of for sale-listings in January," according to Danielle Hale, realtor.com®'s chief economist. "This is a challenging sign for the large numbers of Millennial and Gen Z buyers coming into the housing market this homebuying season as it implies the potential for rising prices and fast-selling homes—a competitive market. In fact, markets such as San Jose in Northern California, which saw inventory down nearly 40 percent last month, are also seeing prices grow by 10 percent while homes are selling at a blistering pace of 51 days."
The supply shortage is found at every price tier throughout the U.S., but it is especially pronounced at the entry-level. In January, properties priced under $200,000 declined by 19 percent, an acceleration compared to December's decline of 18.1 percent. The decline in inventory of mid-tier properties priced between $200,000 and $750,000 also accelerated, to a decline of 12 percent year-over-year, compared to December's 10.2 percent decline. Even upper-tier properties priced at more than $750,000 declined by 5.9 percent year-over-year compared to December's decline of 4.4 percent.
As inventory reached its lowest point on record, both listing prices and days on market reacted to the imbalance of supply and demand. The median U.S. listing price grew by 3.4 percent year-over-year, to $299,995 in January, while prices in 18 metros grew by more than 10 percent. Of the 50 largest metros, 46 saw year-over-year gains in median listing prices, with Philadelphia as the nation's standout with a 16.0 percent increase over last year. Additionally, with the lack of supply, homes are selling in an average of 86 days, two days more quickly than January of last year.
Where Housing Supply Changed the Most
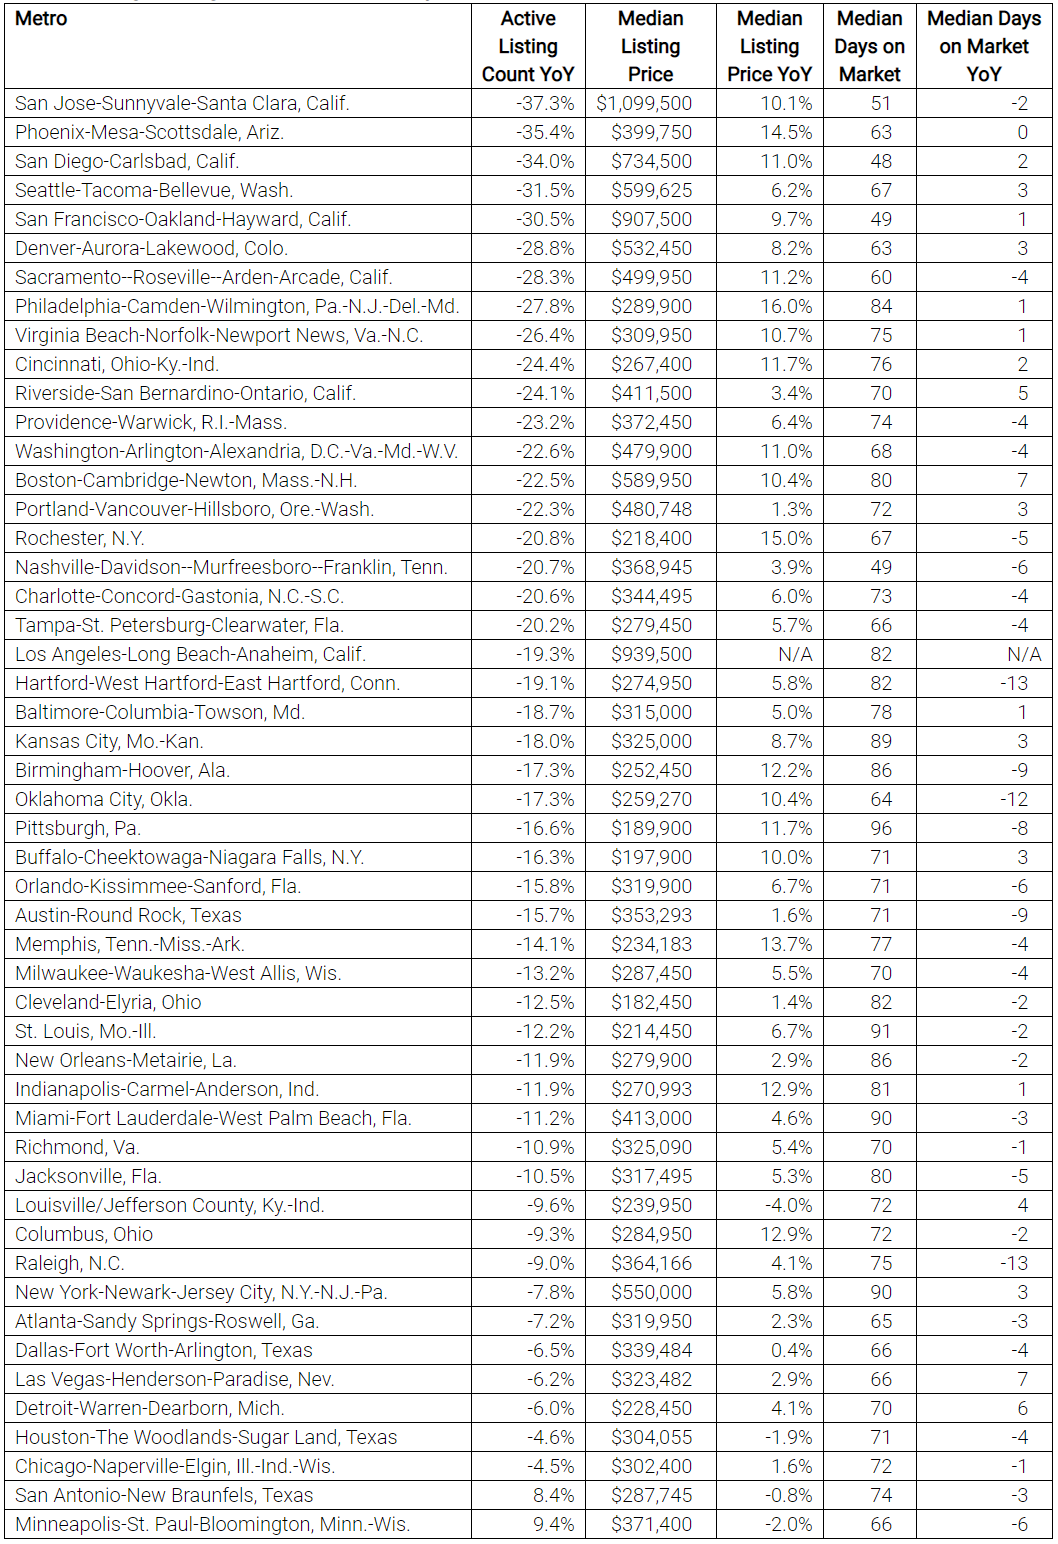
The metros which saw the largest declines in housing inventory were San Jose-Sunnyvale-Santa Clara, Calif. (-37.3 percent); Phoenix-Mesa-Scottsdale, Ariz. (-35.4 percent); and San Diego-Carlsbad, Calif. (-34.0 percent). Other markets across the country where housing supply had sharp declines included Denver-Aurora-Lakewood, Colo. (-28.8 percent); Philadelphia-Camden-Wilmington, Pa.-N.J.-Del.-Md. (-27.8 percent); and Cincinnati, Ohio-Ky.-Ind. (-24.4 percent).
Only two of the 50 largest metros saw inventory increase year-over-year: Minneapolis-St. Paul-Bloomington, Minn.-Wis. (+9.4 percent); and San Antonio-New Braunfels, Texas (+8.4 percent).
Where Prices Changed the Most
Philadelphia-Camden-Wilmington, Pa.-N.J.-Del.-Md. (+16.0 percent); Rochester, N.Y. (+15.0 percent); and Phoenix-Mesa-Scottsdale, Ariz. (+14.5 percent) posted the highest year-over-year median list price growth in January. Other markets across the country where housing prices shot up included Memphis, Tenn.-Miss.-Ark. (+13.7 percent); and Indianapolis-Carmel-Anderson, Ind. (+12.9 percent).
The steepest price declines were seen in Louisville/Jefferson County, Ky.-Ind. (-4.0 percent); Minneapolis-St. Paul-Bloomington, Minn.-Wis. (-2.0 percent); and Houston-The Woodlands-Sugarland, Texas (-1.9 percent). However, each of these markets saw yearly price declines decelerate compared to December.
Where Days on Market Changed the Most
Hartford-West Hartford-East Hartford, Conn.; Raleigh, N.C.; and Oklahoma City, Okla.; saw the largest decreases in days on market with properties spending 13, 13, and 12 fewer days on the market than last year, respectively. Other markets across the country where houses sold faster than last year included Austin-Round Rock, Texas (-9 days); Minneapolis-St. Paul-Bloomington, Minn.-Wis. (-6 days); and Orlando-Kissimmee-Sanford, Fla. (-6 days).
Meanwhile, properties in Las Vegas-Henderson-Paradise, Nev.; Boston-Cambridge-Newton, Mass.-N.H.; and Detroit-Warren-Dearborn, Mich. sold 7, 7, and 6 days more slowly, respectively.
Metros Seeing the Largest Declines in Inventory
About realtor.com®
Realtor.com® makes buying, selling and living in homes easier and more rewarding for everyone. Realtor.com® pioneered the world of digital real estate 20 years ago, and today through its website and mobile apps is a trusted source for the information, tools and professional expertise that help people move confidently through every step of their home journey. Using proprietary data science and machine learning technology, realtor.com® pairs buyers and sellers with local agents in their market, helping take the guesswork out of buying and selling a home. For professionals, realtor.com® is a trusted provider of consumer connections and branding solutions that help them succeed in today's on-demand world. Realtor.com® is operated by News Corp [Nasdaq: NWS, NWSA] [ASX: NWS, NWSLV] subsidiary Move, Inc. under a perpetual license from the National Association of REALTORS®. For more information, visit realtor.com.