
RETECHNOLOGY PREMIUM MARKETPLACE RELATED PRODUCTS | WEBINARS | SPECIAL OFFERS


You are viewing our site as an Agent, Switch Your View:
Agent | Broker Reset Filters to Default Back to ListU.S. Housing Inventory Tightens as Competition Heats Up
November 03 2019
Interest rates are making it cheaper to buy a home, if you can find one
SANTA CLARA, Calif., Oct. 31, 2019 -- The U.S. housing market showed signs of becoming increasingly competitive as inventory continued to tighten with a drop of nearly 98,000 listings, compared to this time last year, according to realtor.com's October 2019 housing trend report* released today. At the same time, the inventory shortage compounded as homes flew off the market at a faster pace than last year, making it harder for would-be buyers to enter the market despite favorable interest rates.
"Owning a home continues to be a priority for buyers, as we head into the cooler months of the year. Driven by the tailwind of sub-4 percent mortgage rates, the steady demand for housing is drying market inventory at an accelerating pace," according to realtor.com® Senior Economist George Ratiu. "With dwindling supply, prices maintain their upward pressure, deepening the affordability challenges for first-time buyers."
Spurred by low mortgage rates, the uptick in demand this past spring gobbled up available inventory leaving the U.S. market depleted. Nationally, inventory decreased 6.9 percent in October, an acceleration from September's 4.1 percent drop. This decline amounted to a loss of 98,000 listings, compared to a year ago.
Additionally, the volume of new listings hitting the market has decreased by 3.4 percent since last year. Entry-level inventory saw the largest declines, with the number of homes priced under $200,000 dropping by 15.2 percent year-over-year. Meanwhile, mid-tier inventory priced between $200,000 and $750,000 dropped by 4.3 percent year-over-year. The inventory of the nation's most expensive homes saw a slight increase as the inventory of homes selling for more than $750,000 increased by 1.3 percent year-over-year.
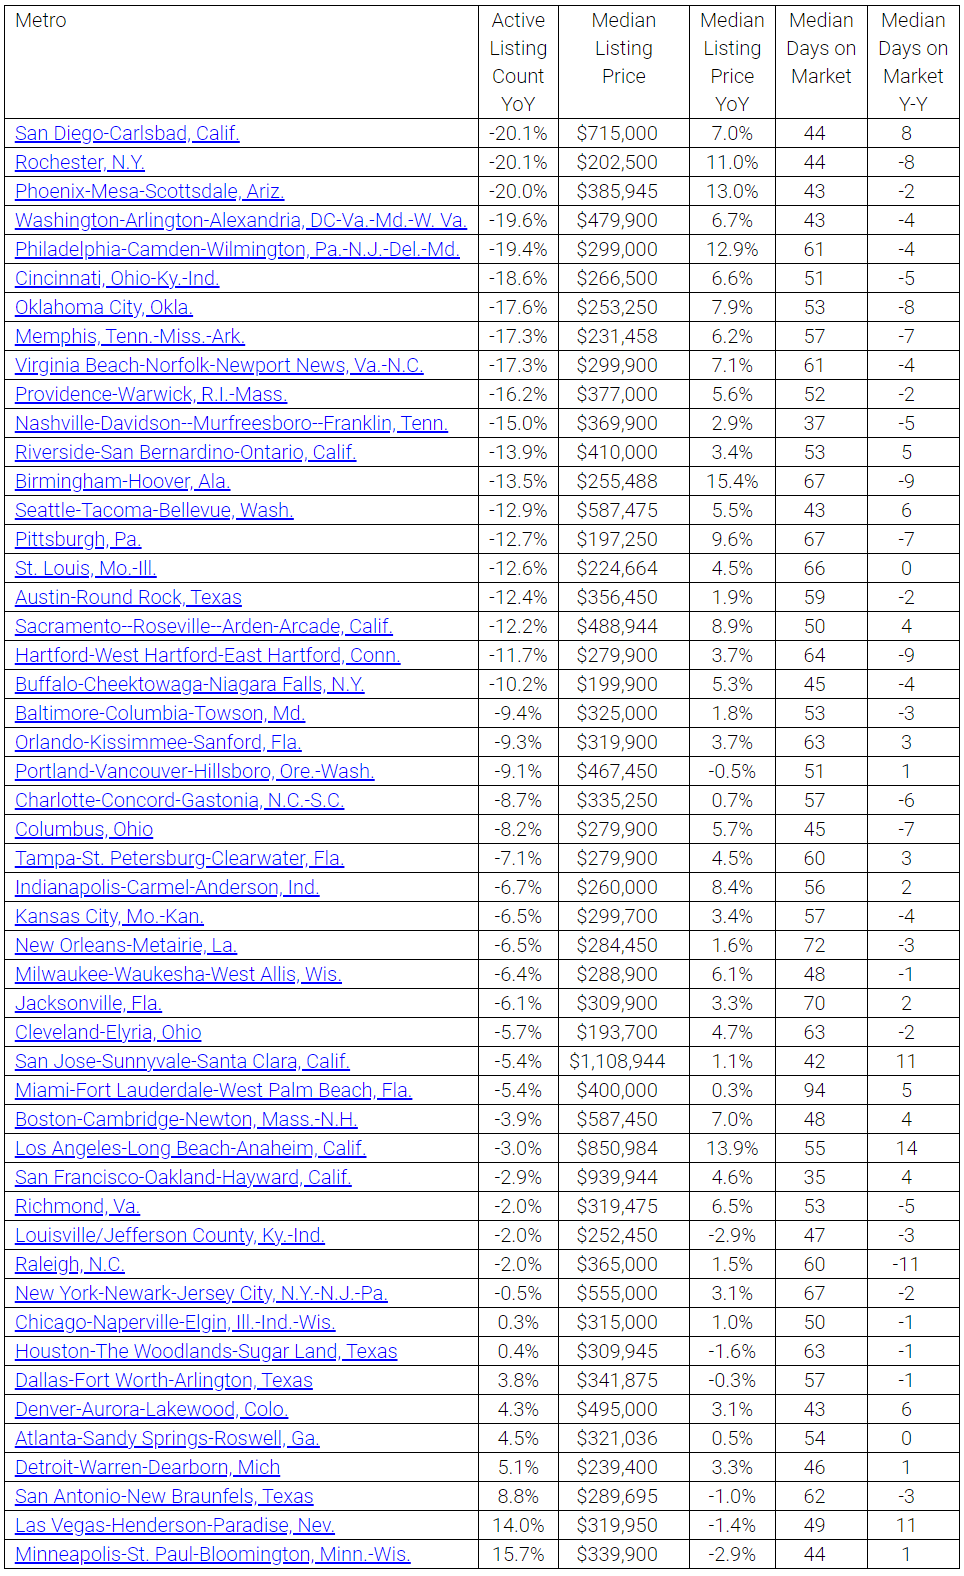
In the nation's 50 largest metros, inventory declined by 5.3 percent year-over-year. The metros which saw the biggest drop in inventory were San Diego-Carlsbad, Calif. (-20.1 percent), Rochester, N.Y. (-20.1 percent), and Phoenix-Mesa-Scottsdale, Ariz. (-20.0 percent).
In addition to having less inventory compared to last year, homes also sold more quickly. Nationally, homes sold in 66 days in October, three days faster than last year. Raleigh, N.C. (60 days); Hartford-West Hartford-East Hartford, Conn. (64 days); and Birmingham-Hoover, Ala. (67 days) saw the largest decreases in days on market with properties spending 11, 9 and 9 fewer days on the market than last year, respectively. On the flip-side, properties in Los Angeles-Long Beach, Anaheim, Calif. (55 days); San Jose-Sunnyvale-Santa Clara, Calif. (42 days), and Las Vegas-Henderson-Paradise, Nev. (49 days); sold 14, 11, and 11 days more slowly, respectively.
The U.S. median listing price continues to increase due to solid demand, growing by 4.3 percent year-over-year, to $312,000 in October. Of the 50 largest U.S. metros, 43 saw year-over-year gains in median listing prices. Birmingham-Hoover, Ala. (+15.4 percent); Los Angeles-Long Beach-Anaheim, Calif. (+13.9 percent); and Phoenix-Mesa-Scottsdale, Ariz. (+13.0 percent); posted the highest year-over-year median list price growth in October. The steepest declines in median list price were seen in Minneapolis-St. Paul-Bloomington, Minn.-Wis. (-2.9 percent), Louisville/Jefferson County, Ky.-Ind. (-2.9 percent) and Houston-The Woodlands-Sugar Land, Texas (-1.6 percent).
*Editor's Note
With the release of its October 2019 housing trends report, realtor.com® incorporated a new and improved methodology for capturing and reporting housing inventory trends and metrics. The new methodology uses the latest and most accurate data mapping of listing statuses to yield a cleaner and more consistent measurement of active listings at both the national and local level. The new methodology also allows realtor.com® to achieve more consistency and stability in measurements across markets and in each market over time. As a result of these changes, the data released today will not be directly comparable with previous releases and realtor.com® economics blog posts. However, future data releases, including historical data, will consistently apply the new methodology.
About realtor.com®
Realtor.com®, The Home of Home Search, offers the most MLS-listed for-sale listings among national real estate portals, and access to information, tools and professional expertise that help people move confidently through every step of their home journey. Through its Opcity platform, realtor.com® uses data science and machine learning to connect consumers with a real estate professional based on their specific buying and selling needs. Realtor.com® pioneered the world of digital real estate 20 years ago, and today is a trusted resource for home buyers, sellers and dreamers by making all things home simple, efficient and enjoyable. Realtor.com® is operated by News Corp [Nasdaq: NWS, NWSA] [ASX: NWS, NWSLV] subsidiary Move, Inc. under a perpetual license from the National Association of REALTORS®. For more information, visit realtor.com.