
RETECHNOLOGY PREMIUM MARKETPLACE RELATED PRODUCTS | WEBINARS | SPECIAL OFFERS


You are viewing our site as an Agent, Switch Your View:
Agent | Broker Reset Filters to Default Back to List296,458 U.S. Properties with Foreclosure Filings in First Six Months of 2019, Down 18 Percent from a Year Ago
August 11 2019
Foreclosure Starts Decrease Nationwide, But Increase in 42 Percent of Local Markets; Q2 2019 Foreclosure Activity Below Pre-Recession Levels in 62 Percent of Markets
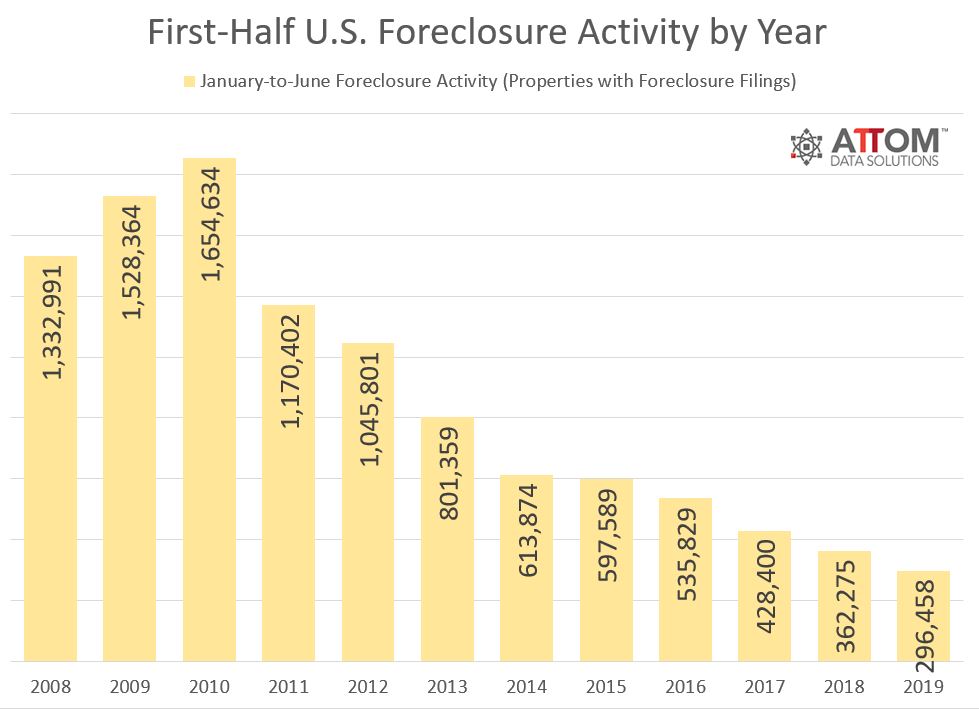
IRVINE, Calif. – August 8, 2019 — ATTOM Data Solutions, curator of the nation's premier property database and first property data provider of Data-as-a-Service (DaaS), today released its Midyear 2019 U.S. Foreclosure Market Report, which shows a total of 296,458 U.S. properties with foreclosure filings — default notices, scheduled auctions or bank repossessions — in the first six months of 2019, down 18 percent from the same period a year ago and down 82 percent from a peak of 1,654,634 in the first six months of 2010.
Counter to the national trend, 36 of the 220 metropolitan statistical areas analyzed in the report (16 percent) posted a year-over-year increase in foreclosure activity in the first six months of 2019, including Buffalo, New York (up 33 percent); Orlando, Florida (up 32 percent); Jacksonville, Florida (up 18 percent); Miami, Florida (up 7 percent); and Tampa-St. Petersburg, Florida (up 5 percent).
"Our midyear 2019 foreclosure activity helps to show an overall view on how foreclosure activity is trending downward," said Todd Teta, chief product officer at ATTOM Data Solutions. "Of course, you still have pockets across the nation where foreclosure activity is seeing some flare-ups. Foreclosure starts is a good indication of markets to watch. For instance, in looking at the largest markets across the nation with the greatest annual increase in foreclosure starts, 4 out of the 5 markets were in Florida. "
New Jersey, Delaware, Maryland post highest state foreclosure rates
Nationwide 0.22 percent of all housing units (one in every 457) had a foreclosure filing in the first six months of 2019.
States with the highest foreclosure rates in the first half of 2019 were New Jersey (0.54 percent); Delaware (0.46 percent); Maryland (0.43 percent); Florida (0.39 percent); and Illinois (0.38 percent).
Other states with first-half 2019 foreclosure rates among the 10 highest nationwide were South Carolina (0.33 percent); Connecticut (0.32 percent); Ohio (0.30 percent); Nevada (0.26 percent); and New Mexico (0.26 percent).
Atlantic City, Jacksonville, Trenton, with highest metro foreclosure rates
Among 220 metropolitan statistical areas analyzed in the report, those with the highest foreclosure rates in the first half of 2019 were Atlantic City, New Jersey (0.92 percent of all housing units with a foreclosure filing); Jacksonville, Florida (0.54 percent); Trenton, New Jersey (0.52 percent); Rockford, Illinois (0.51 percent); and Lakeland, Florida (0.51 percent).
Other metro areas with foreclosure rates ranking among the top 10 highest in the first half of 2019 were Columbia, South Carolina (0.49 percent); Ocala, Florida (0.49 percent); Philadelphia, Pennsylvania (.48 percent); Fayetteville, North Carolina (0.47 percent); and Baltimore, Maryland (0.44 percent).
First-half foreclosure starts down nationwide, up in 42 percent of local markets
A total of 177,015 U.S. properties started the foreclosure process in the first six months of 2019, down 8 percent from the first half of 2018 and down 84 percent from a peak of 1,074,471 in the first half of 2009.
Counter to the national trend, 16 states posted a year-over-year increase in foreclosure starts in the first half of 2019, including Mississippi (up 56 percent); Florida (up 28 percent); Georgia (up 22 percent); Arkansas (up 21 percent); and Louisiana (up 19 percent).
Also counter to the national trend, 92 of the 217 metro areas analyzed in the report (42 percent) posted year-over-year increases in foreclosure starts in the first half of 2019, including Miami, Florida (up 32 percent); Tampa-St. Petersburg, Florida (up 18 percent); Atlanta, Georgia (up 16 percent); Washington D.C. (up 8 percent); and Denver, Colorado (up 6 percent).
Q2 2019 foreclosure activity below pre-recession levels in 62 percent of markets
A total of 152,760 U.S. properties had a foreclosure filing in Q2 2019, down 6 percent from the previous quarter and down 19 percent from a year ago. The second quarter of 2019 was the eleventh consecutive quarter in which U.S. foreclosure activity was below the pre-recession average of 278,912 properties with foreclosure filings per quarter in 2006 and 2007.
Foreclosure activity in the second quarter of 2019 was below pre-recession averages in 136 of the 220 metropolitan statistical areas analyzed in the report (62 percent), including Denver, Colorado (92 percent below); Detroit, Michigan (89 percent below); Dallas-Fort Worth, Texas (81 percent below); Atlanta, Georgia (80 percent below); and Memphis, Tennessee (80 percent below).
Counter to the national trend, 84 of the 220 metropolitan statistical areas analyzed in the report (38 percent) posted Q2 2019 foreclosure activity totals above their pre-recession averages, including New Orleans, Louisiana (56 percent above); Birmingham, Alabama (26 percent above); Washington, D.C. (22 percent above); Philadelphia, Pennsylvania (6 percent above); New York-Newark-Jersey City (up 4 percent).
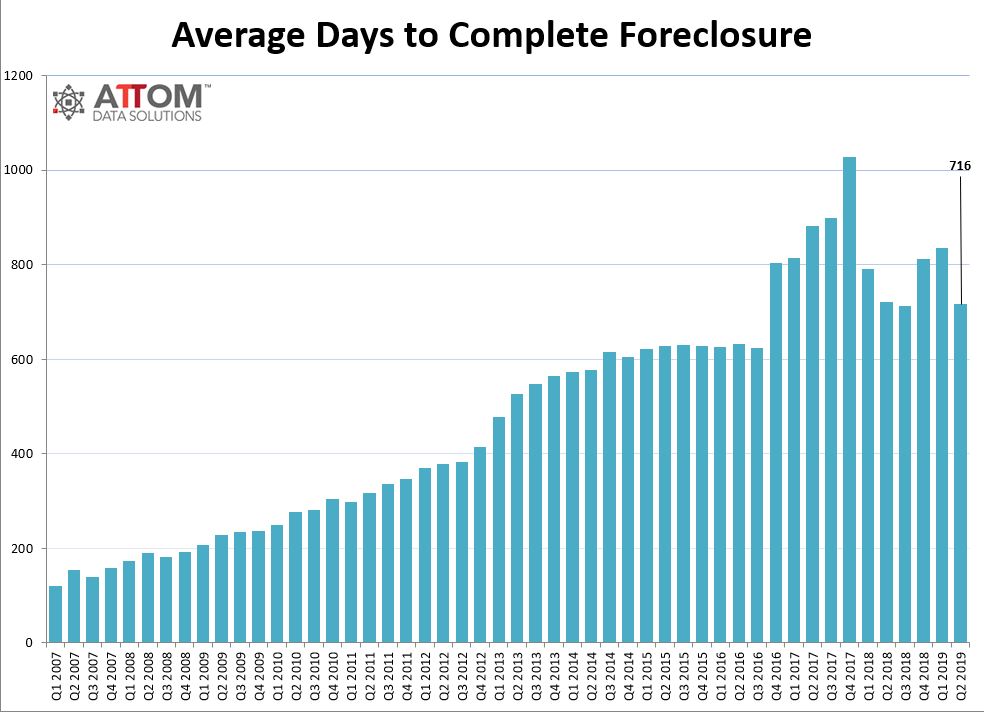
Average foreclosure timeline drops to lowest level since Q3 2018
Properties foreclosed in the second quarter of 2019 took an average of 716 days from the first public foreclosure notice to complete the foreclosure process, down from 835 days in the previous quarter and down from 720 days in the second quarter of 2018.
States with the longest average foreclosure timelines for foreclosures completed in Q2 2019 were Hawaii (1,611 days), Indiana (1,360 days), Florida (1,073 days), New York (1,057 days), and New Jersey (982 days).
States with the shortest average foreclosure timelines for foreclosures completed in Q2 2019 were Mississippi (195 days), Minnesota (226 days), Virginia (228 days), Alaska (242 days), and Maine (277 days).
About ATTOM Data Solutions
ATTOM Data Solutions provides premium property data to power products that improve transparency, innovation, efficiency and disruption in a data-driven economy. ATTOM multi-sources property tax, deed, mortgage, foreclosure, environmental risk, natural hazard, and neighborhood data for more than 155 million U.S. residential and commercial properties covering 99 percent of the nation's population. A rigorous data management process involving more than 20 steps validates, standardizes and enhances the data collected by ATTOM, assigning each property record with a persistent, unique ID — the ATTOM ID. The 9TB ATTOM Data Warehouse fuels innovation in many industries including mortgage, real estate, insurance, marketing, government and more through flexible data delivery solutions that include bulk file licenses, APIs, market trends, marketing lists, match & append and introducing the first property data deliver solution, a cloud-based data platform that streamlines data management – Data-as-a-Service (DaaS).