
RETECHNOLOGY PREMIUM MARKETPLACE RELATED PRODUCTS | WEBINARS | SPECIAL OFFERS


You are viewing our site as an Agent, Switch Your View:
Agent | Broker Reset Filters to Default Back to ListU.S. Home Prices Continue Upward Trajectory
May 05 2019
Median list price hits $310,000; newly listed homes increase 3 percent year-over-year; national inventory increases 4 percent year-over-year
SANTA CLARA, Calif., May 1, 2019 -- The national median listing price set a record of $310,000 in April -- surpassing March's high of $300,000, according to realtor.com's April 2019 monthly housing trend report released today. At the same time, demand for U.S. housing is cooling heading into spring as newly listed homes and national inventory grew, primarily driven by a combination of more owners listing homes and softening buyer demand.
"The U.S. median listing price set another record this month, which we expect it to continue to do through summer when prices typically hit their seasonal peak," said Danielle Hale, realtor.com®'s chief economist. "Despite growing availability of total homes for sale, prices are rising in response to more high-end homes for sale, which is not exactly what most shoppers in today's market are looking for. Inventory remains limited at the entry-level, where much of housing's demand is concentrated. This mismatch is a prime driver of the weaker sales we've seen so far in 2019."
Much of this price growth continues to be driven by an increase in upper-tier homes for sale. In April, the number of homes for sale over $750,000 increased by 11 percent year-over-year, while homes priced under $200,000 decreased by 8 percent. As the median listing price grows and the number of affordable, entry-level homes decreases, entry-level shoppers will likely face though competition this spring.
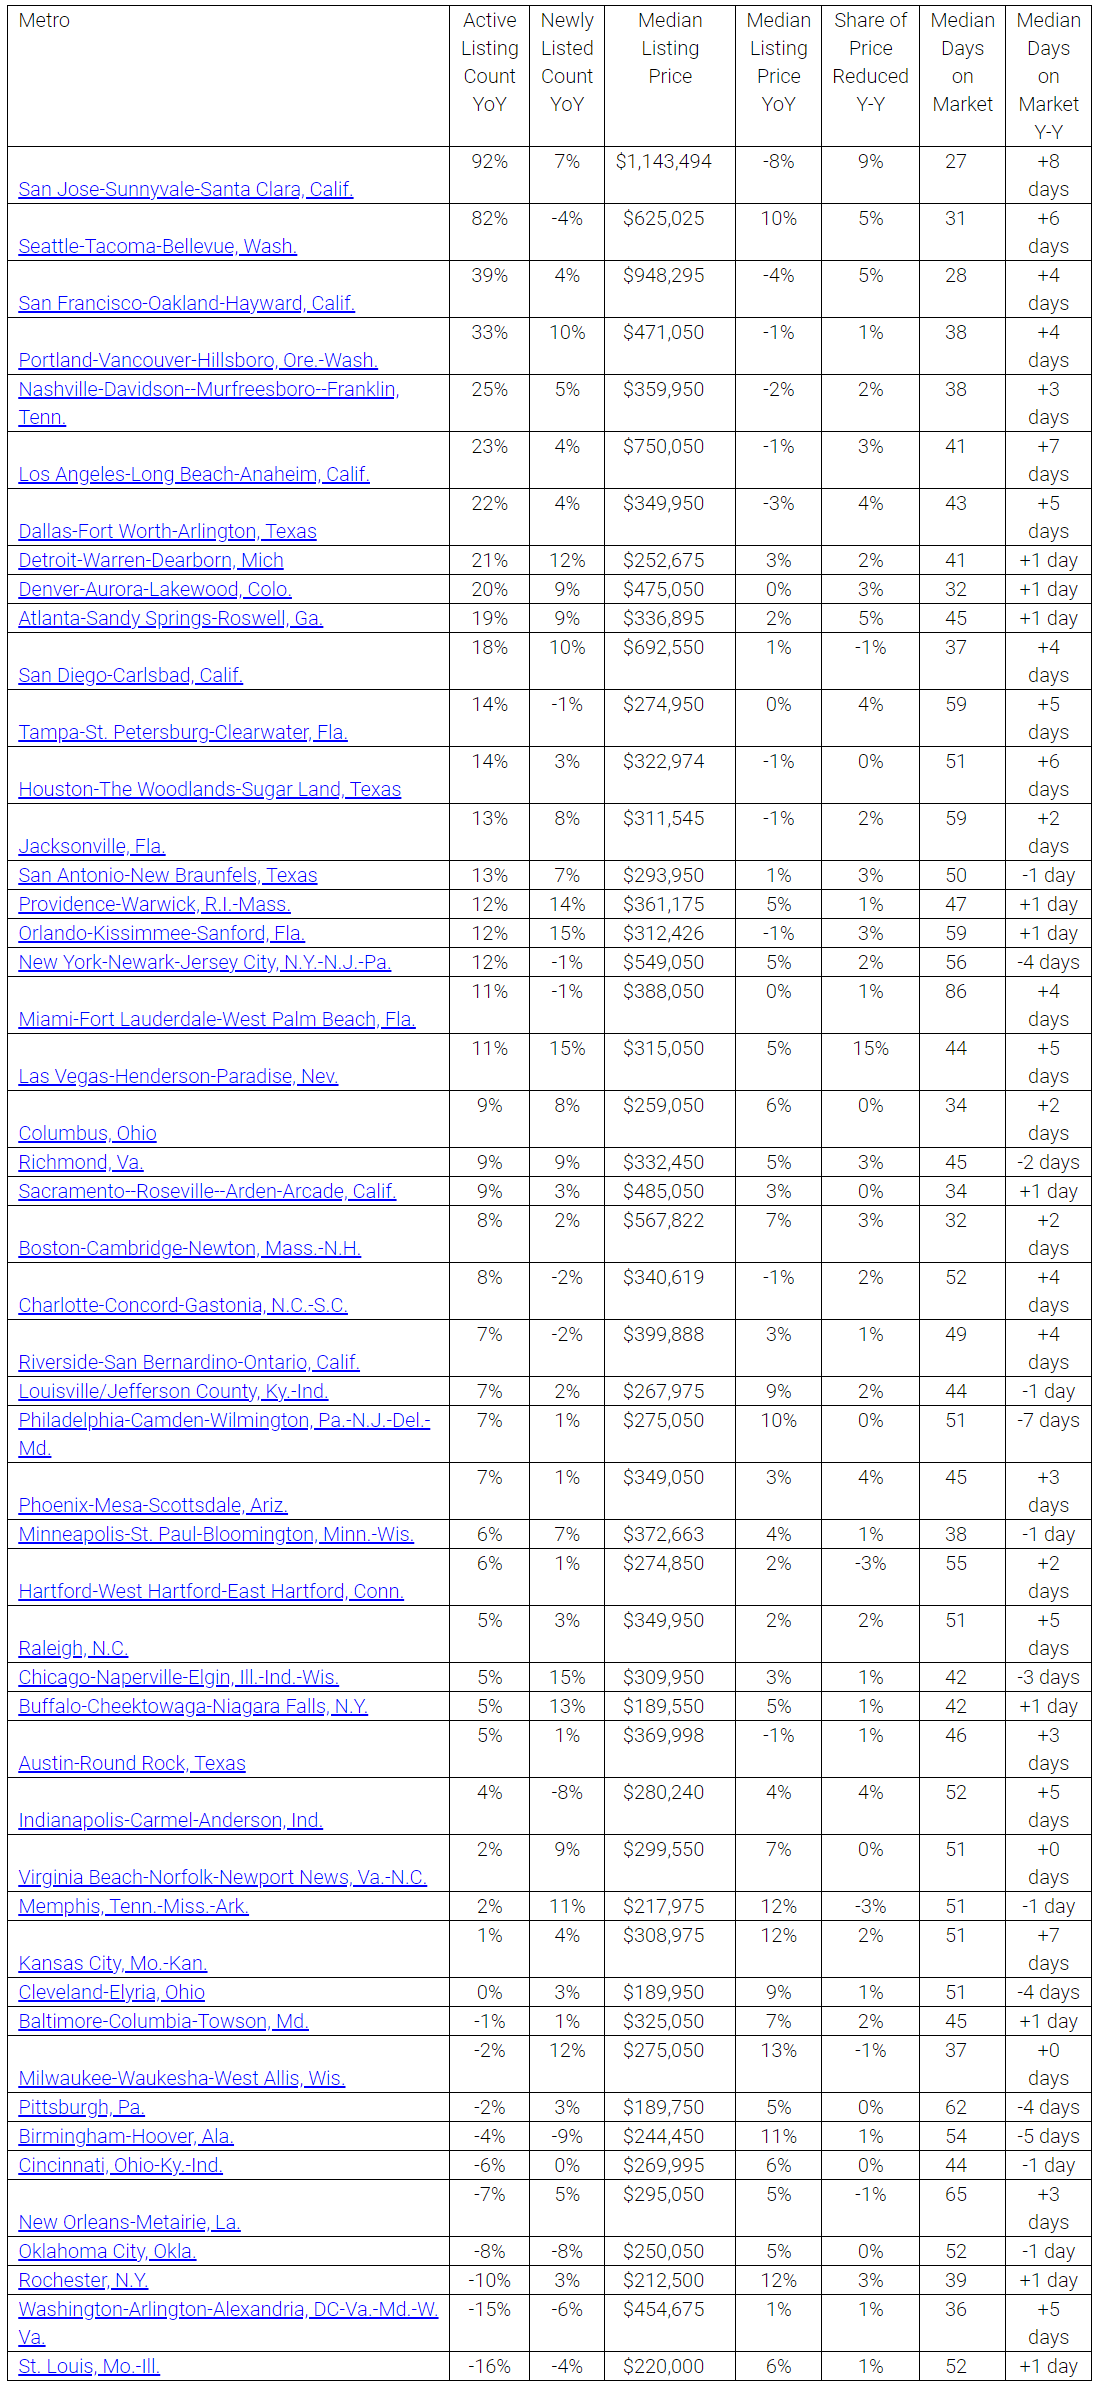
Of the 50 largest U.S. metros, 36 saw year-over-year increases in median listing prices, but only 9 markets outpaced the national growth of 7 percent. Milwaukee, (+13 percent), Kansas City, Mo. (+12 percent), and Rochester, N.Y. (+12 percent), posted the largest year-over-year median list price growth in April.
The steepest median listing price declines were seen in San Jose, Calif., where prices were down 8 percent. San Francisco and Dallas followed, with 4 percent and 3 percent declines year-over-year, respectively. These markets were ranked first, third, and seventh for inventory growth -- as supply begins to exceed demand, prices are declining to adjust and balance the market.
While prices continue to rise, inventory is also seeing continued growth as both newly listed homes and national inventory saw growth last month. In April, approximately 60,000 additional listings hit the U.S. market compared to last year, amounting to a 4 percent increase year-over-year. Much of this growth has been concentrated in the nation's 50 largest markets, where inventory grew at a rapid pace of 10 percent year-over-year. At the same time, newly listed homes in the U.S. have increased 3 percent year-over-year. The combination of newly listed homes and national inventory growth means the U.S. will continue to see inventories ease, especially at the top end of the market.
Large metros that saw the greatest gains in inventory were San Jose, Calif., Seattle, and San Francisco, growing by 92 percent, 82 percent and 39 percent, respectively. Metros with the greatest declines in inventory included St. Louis, Washington, D.C. and Rochester, N.Y.; where inventory declined by 16 percent, 15 percent and 10 percent, respectively. Sellers in pricey west coast markets are likely trying to offload their homes at peak pricing, but in more affordable markets, such as St. Louis, inventory is declining as buyers seek price relief. One expensive outlier is Washington D.C., where inventory declines may be attributed to sellers holding onto their homes in anticipation of the opening of HQ2, Hale added.
In April, the share of homes that had their prices cut increased by 2 percent year-over-year. Among the nation's largest markets, 37 of the 50 saw an increase in their share of price reductions year-over-year. Las Vegas had the greatest increase in price reductions, up 15 percent year-over-year. It was followed by San Jose, Calif., with a 9 percent increase in reductions, while Seattle, San Francisco, and Atlanta each had a 5 percent increase in reductions year-over-year.
Nationally, homes sold in 58 days in April, one day more quickly than a year ago and seven days faster than in March. In the 50 largest U.S. metros, the homes spent an average of two more days on the market compared to the previous year. San Jose, Calif., Los Angeles, and Kansas City, Mo., saw the largest increases in days on market with properties spending 8, 7 and 7 more days on the market, respectively. Alternatively, properties in Philadelphia; Birmingham, Ala. and Pittsburgh, Pa., sold 7, 5 and 4 days more quickly than last year, respectively.
Metros Seeing the Largest Gains in Inventory
About realtor.com®
Realtor.com®, The Home of Home Search℠, offers an extensive inventory of for-sale and rental listings, and access to information, tools and professional expertise that help people move confidently through every step of their home journey. It pioneered the world of digital real estate 20 years ago, and today is the trusted resource for home buyers, sellers and dreamers by making all things home simple, efficient and enjoyable. Realtor.com® is operated by News Corp [Nasdaq: NWS, NWSA] [ASX: NWS, NWSLV] subsidiary Move, Inc. under a perpetual license from the National Association of REALTORS®. For more information, visit realtor.com.