
RETECHNOLOGY PREMIUM MARKETPLACE RELATED PRODUCTS | WEBINARS | SPECIAL OFFERS


You are viewing our site as an Agent, Switch Your View:
Agent | Broker Reset Filters to Default Back to ListHighest Share of Homeowners Likely to Move in Q3 2018 in Chicago, DC, Orlando, Tampa, Atlanta
August 20 2018
Lowest Share of Pre-Movers in Cleveland, Boston, Pittsburgh, Detroit, San Francisco; North Dakota, Illinois, Nevada, Virginia and Colorado the Top Five Pre-Mover States
IRVINE, Calif. – Aug. 16, 2018 — ATTOM Data Solutions, curator of the nation's premier property database, today released its Q2 2018 Pre-Mover Housing Index, which shows Chicago, Washington, D.C., Orlando, Tampa-St. Petersburg and Atlanta posted the highest pre-mover index in the second quarter of 2018 — predictive of a high percentage of homeowners moving in the third quarter — among 36 metropolitan statistical areas with at least 500,000 single family homes and condos.
Using data collected from purchase loan applications on residential real estate transactions, the ATTOM Data Solutions Pre-Mover Housing Index is based on the ratio of homes with a "pre-mover" indicator to total single family homes and condos in a given geography, indexed off the national average. An index above 100 is above the national average and indicates an above-average ratio of homes that will likely be sold in the next 90 days in a given market (see full methodology below).
Among a broader set of 131 metro areas with at least 100,000 single family homes and condos, those posting the highest pre-mover index in Q2 2018 were Wilmington, North Carolina (206); Colorado Springs, Colorado (178); and Manchester-Nashua, New Hampshire (172); followed by Chicago (168) and Washington, D.C. (166).
"A higher pre-mover index bodes well for local real estate agents, home improvement stores, moving companies and others that benefit from the halo effect of a home sale," said Daren Blomquist, senior vice president at ATTOM Data Solutions. "Meanwhile markets with a low pre-mover index likely have a scarcity of inventory available to buy or relatively weak demand from prospective buyers — or some combination of both — which is not optimal for businesses that rely on the home sale halo effect."
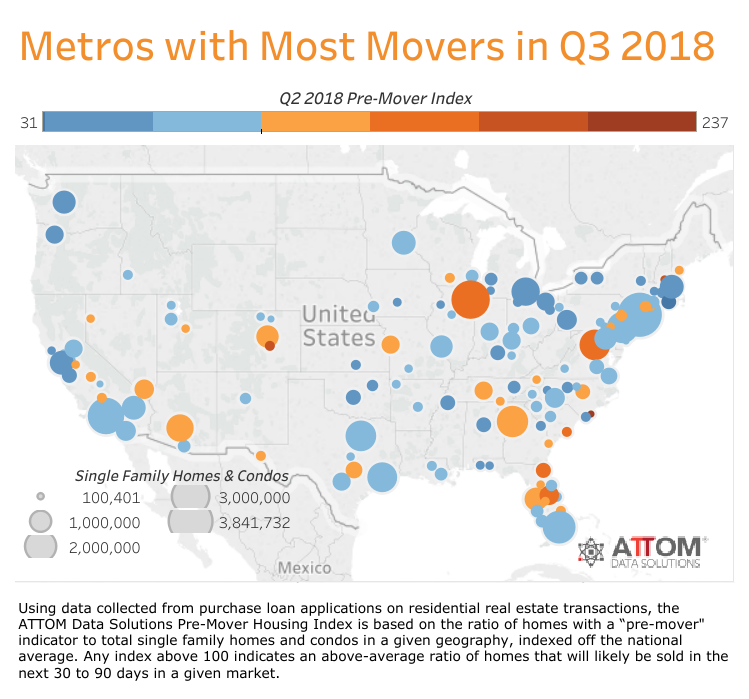
Cleveland, Boston, Pittsburgh post lowest pre-mover indexes among major metros
Among the 36 metros with at least 500,000 single family homes and condos, those with the lowest pre-mover index in Q2 2018 were Cleveland, Ohio (38); Boston, Massachusetts (39); Pittsburgh, Pennsylvania (48); Detroit, Michigan (48); and San Francisco, California (49).
Among the broader set of 131 metro areas with at least 100,000 single family homes and condos, those with the lowest pre-mover index in Q2 2018 were Providence, Rhode Island (31); Albany, New York (35); San Jose, California (37); Buffalo, New York (38); and Cleveland, Ohio (38).
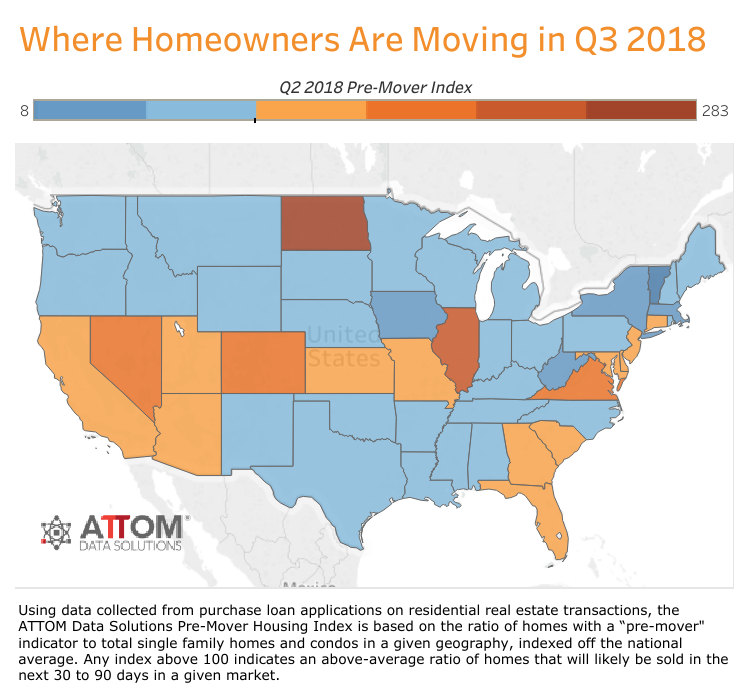
North Dakota, Illinois, Nevada post highest pre-mover indexes among states
States with the highest pre-mover index in the second quarter of 2018 — predictive of a high percentage of homeowners moving in the third quarter — were North Dakota (275), Illinois (193), Nevada (164), Virginia (163), and Colorado (147).
Other states with a pre-mover index among the 10 highest in Q2 2018 were New Jersey (133), Florida (133), Delaware (130), Maryland (127), and Utah (124).
Chicago and DC counties post highest county pre-mover indexes
Among 394 counties analyzed in the report, those with the highest pre-mover index in Q2 2018 were Kendall County, Illinois, in the Chicago metro area (461); Albemarle County, Virginia, in the Charlottesville metro area (337); followed by three Virginia counties all in the Washington, D.C. metro area: Loudon County (319), Alexandria City (307); and Spotsylvania County (294).
San Francisco and New York City counties post lowest county pre-mover indexes
Among the same 394 counties, those with the lowest pre-mover index in Q2 2018 were San Francisco County, California (31); Queens County, New York (33); Westchester County, New York (36); Westmoreland County, Pennsylvania in the Pittsburgh metro area (39); and Cameron County, Texas in the Brownsville-Harlingen metro area (42).
Highest share of investment property pre-movers in Memphis, Indianapolis, Knoxville
Nationwide 4.6 percent of all single family homes and condos with a pre-mover indicator in Q2 2018 were being purchased as an investment property.
Among the 131 metropolitan statistical areas analyzed in the report, the highest share of pre-mover investment homes were in Memphis, Tennessee (21.3 percent); Indianapolis, Indiana (10.9 percent); Knoxville, Tennessee (10.1 percent); Dayton, Ohio (9.4 percent); and Fort Collins-Loveland, Colorado (9.3 percent).
Highest share of second home pre-movers in Ocean City, Naples, Myrtle Beach
Nationwide 3.2 percent of all single family homes and condos with a pre-mover indicator in Q2 2018 were being purchased as a second home.
Among the 131 metropolitan statistical areas analyzed in the report, the highest share of pre-mover second homes were in Ocean City, New Jersey (34.6 percent); Naples-Marco Island, Florida (31.3 percent); Myrtle Beach, South Carolina (25.2 percent); Cape Coral-Fort Myers, Florida (20.9 percent); and Wilmington, North Carolina (15.7 percent).
About ATTOM Data Solutions
ATTOM Data Solutions provides premium property data to power products that improve transparency, innovation, efficiency and disruption in a data-driven economy. ATTOM multi-sources property tax, deed, mortgage, foreclosure, environmental risk, natural hazard, and neighborhood data for more than 155 million U.S. residential and commercial properties covering 99 percent of the nation's population. A rigorous data management process involving more than 20 steps validates, standardizes and enhances the data collected by ATTOM, assigning each property record with a persistent, unique ID — the ATTOM ID. The 9TB ATTOM Data Warehouse fuels innovation in many industries including mortgage, real estate, insurance, marketing, government and more through flexible data delivery solutions that include bulk file licenses, APIs, market trends, marketing lists, match & append and more.