
RETECHNOLOGY PREMIUM MARKETPLACE RELATED PRODUCTS | WEBINARS | SPECIAL OFFERS


You are viewing our site as an Agent, Switch Your View:
Agent | Broker Reset Filters to Default Back to ListNumber of Equity Rich U.S. Properties Increases to 14 Million in Q2 2017 — One in Four U.S. Properties With a Mortgage
August 18 2017
Highest Share of Equity Rich in San Jose, San Francisco, Los Angeles, Honolulu, Portland; 5.4 Million Seriously Underwater Properties in Q2 2017, Down 1.2 Million From a Year Ago
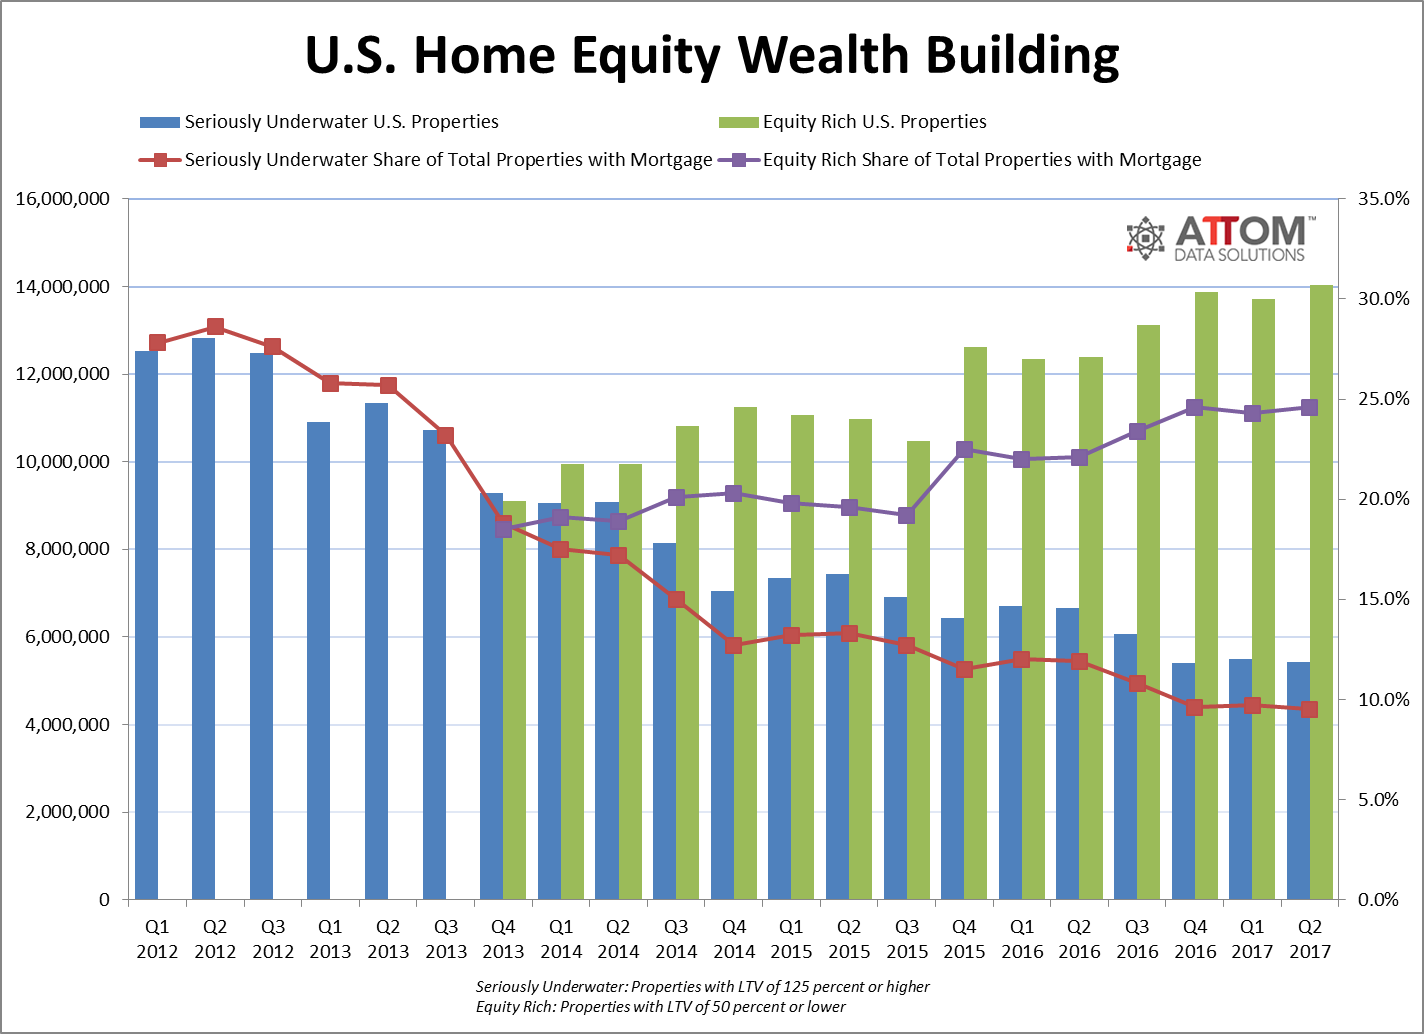
IRVINE, Calif. — Aug. 17, 2017 — ATTOM Data Solutions, curator of the nation's largest multi-sourced property database, today released its Q2 2017 U.S. Home Equity & Underwater Report, which shows that at the end of the second quarter of 2017 there were more than 14 million (14,038,372) U.S. properties that were equity rich — where the combined loan amount secured by the property was 50 percent or less of the estimated market value of the property — up by nearly 320,000 properties from the previous quarter and up by more than 1.6 million properties from a year ago.
The 14 million equity rich U.S. properties represented 24.6 percent of all U.S. properties with a mortgage, up from 24.3 percent in the previous quarter and up from 22.1 percent in Q2 2016.
The report is based on publicly recorded mortgage and deed of trust data collected and licensed by ATTOM Data Solutions nationwide along with an industry standard automated valuation model (AVM) updated monthly in the ATTOM Data Warehouse of more than 150 million U.S. properties (see full methodology below).
The report also shows that more than 5.4 million (5,433,684) U.S. properties were still seriously underwater — where the combined loan amount secured by the property was at least 25 percent higher than the property's estimated market value — at the end of Q2 2017, down by more than 64,000 properties from the previous quarter and down by more than 1.2 million from a year ago.
The 5.4 million seriously underwater properties represented 9.5 percent of all properties with a mortgage, down from 9.7 percent in the previous quarter and down from 11.9 percent in Q2 2016.
"An increasing number of U.S. homeowners are amassing impressive stockpiles of home equity wealth, enjoying the benefits of rapidly rising home prices while staying conservative when it comes to cashing out on their equity — homeowners are staying in their homes nearly twice as long before selling as they were prior to the Great Recession, and the volume of home equity lines of credit are running about one-third of the level they were at during the last housing boom," said Daren Blomquist, senior vice president at ATTOM Data Solutions. "However, this home equity wealth is unevenly distributed across different geographies, value ranges, occupancy statuses and lengths of ownership, with a disproportionately high equity rich share among high-end properties, investor-owned properties and properties owned for more than 20 years."
Highest share of equity rich in San Jose, San Francisco, LA, Honolulu, Portland
States with the highest share of equity rich properties at the end of Q2 2017 were Hawaii (38.3 percent); California (36.6 percent); New York (34.2 percent); Vermont (33.5 percent); and Oregon (32.2 percent).
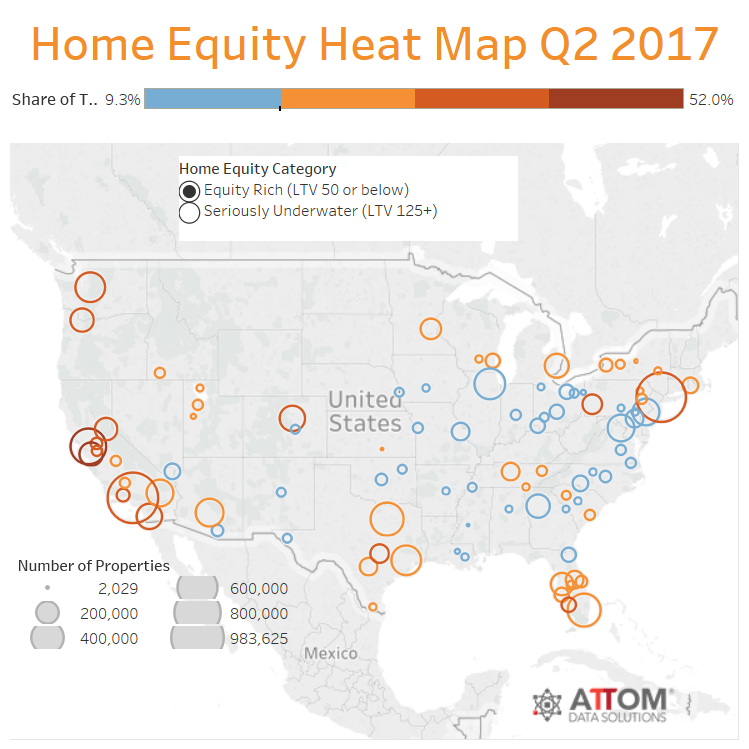
Among 91 metropolitan statistical areas with a population of 500,000 or more, those with the highest share of equity rich properties were San Jose, California (52.0 percent); San Francisco, California (47.0 percent); Los Angeles, California (40.0 percent); Honolulu, Hawaii (40.0 percent); and Portland, Oregon (35.0 percent).
Among 7,192 U.S. zip codes with at least 2,500 people, those with the highest share of equity rich properties were 15201 in Pittsburgh, Pennsylvania (74.4 percent); 11220 in Brooklyn, New York (74.2 percent); 11228 in Brooklyn, New York (71.6 percent); 78207 in San Antonio, Texas (71.3 percent); and 11355 in Flushing, New York (71.1 percent).
Profile of equity rich properties
Some characteristics of the 14 million equity rich U.S. properties as of the end of Q2 2017:
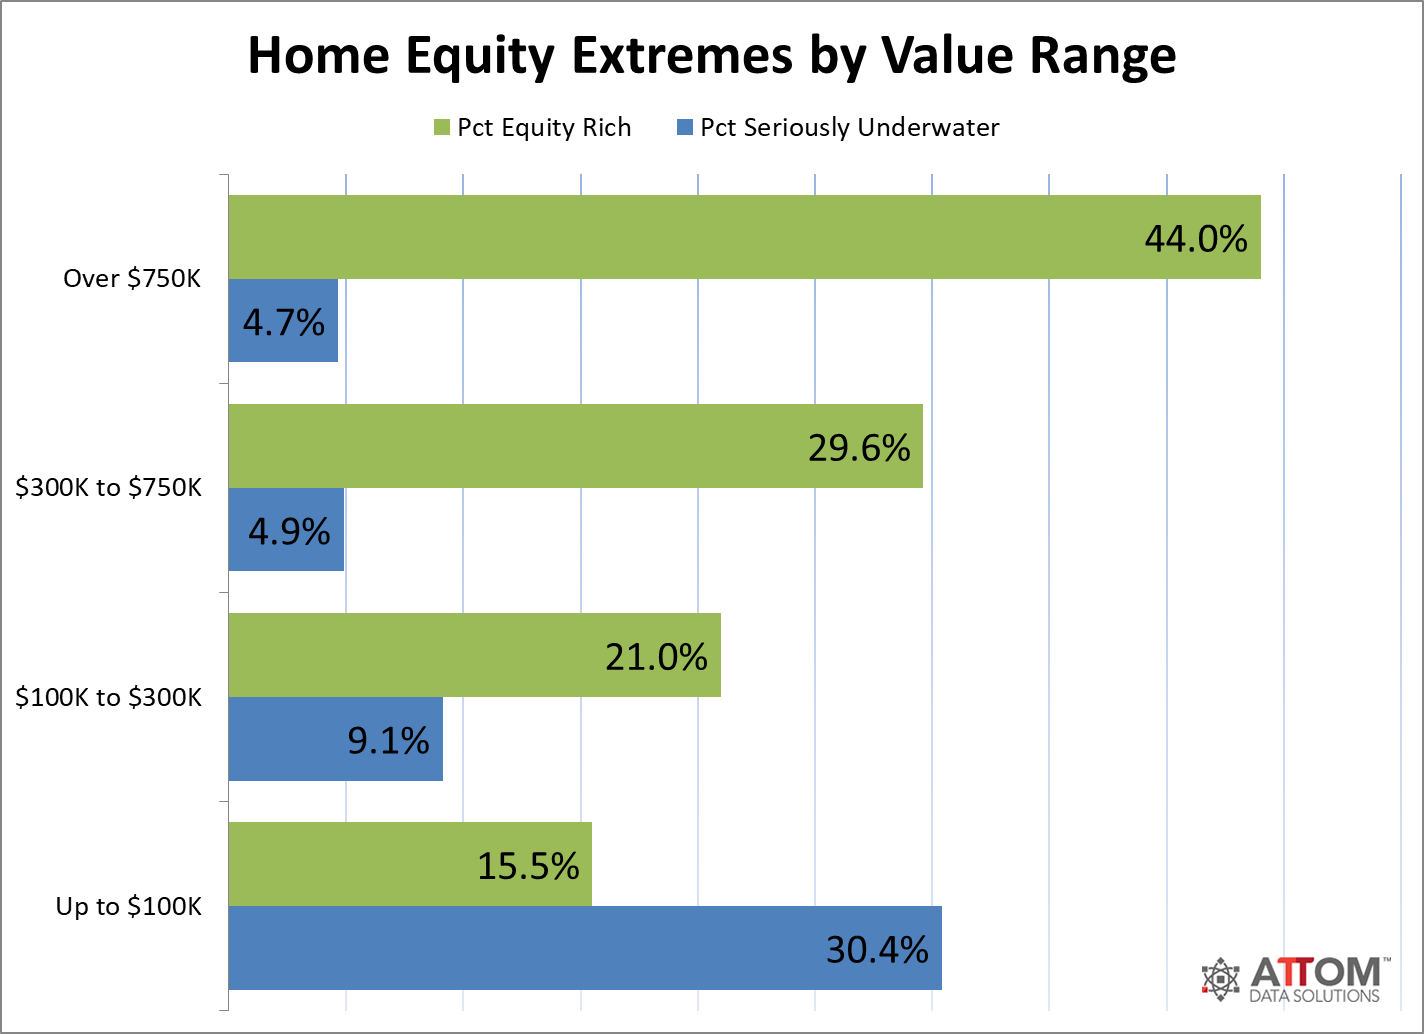
- 44.0 percent of properties with an estimated market value over $750,000 were equity rich, compared to an equity rich rate of 29.6 percent for properties valued between $300,000 and $750,000; 21.0 percent for properties valued between $100,000 and $300,000; and 15.5 percent for properties valued up to $100,000.
- 45.7 percent of properties owned more than 20 years were equity rich, while only 10 percent of properties owned less than a year were equity rich.
- 27.1 percent of non-owner occupied (investment) properties with a mortgage were equity rich as of the end of Q2 2017 compared to 23.8 percent of owner-occupied properties.
Highest share of seriously underwater in Cleveland, Baton Rouge, Akron, Las Vegas, Toledo
States with the highest share of seriously underwater properties as of the end of Q2 2017 were Nevada (17.4 percent), Louisiana (17.1 percent); Illinois (16.8 percent); Ohio (16.5 percent); and Indiana (16.4 percent).
Among 91 metropolitan statistical areas with a population of 500,000 or more, those with the highest share of seriously underwater properties were Cleveland, Ohio (21.8 percent); Baton Rouge, Louisiana (21.0 percent); Akron, Ohio (20.5 percent); Las Vegas, Nevada (20.2 percent); and Toledo, Ohio (20.2 percent).
"Ohio housing has been increasing in value quarter over quarter, and the report shows the number of homes with negative equity has decreased substantially in 2017, with a decrease of nearly 100,000 properties statewide compared to a year ago," said Matthew Watercutter, senior regional vice president and broker of record for HER Realtors, covering the Dayton, Columbus and Cincinnati markets in Ohio. "A shortage of inventory and increase in overall cost for new construction has caused the value of existing homes to increase at an accelerated rate in 201, lowering the overall number of homes underwater."
Among 7,192 U.S. zip codes with at least 2,500 properties with mortgages, those with the highest share of seriously underwater properties were 89109 in Las Vegas, Nevada (69.9 percent); 48235 in Detroit, Michigan (69.1 percent); 60466 in Park Forest, Illinois (68.4 percent); 08611 in Trenton, New Jersey (68.0 percent); and 48228 in Detroit, Michigan (67.5 percent).
Profile of seriously underwater properties
Some characteristics of the 5.4 million seriously underwater U.S. properties as of the end of Q2 2017:
- 30.4 percent of properties with an estimated market value of $100,000 or less were seriously underwater compared to a seriously underwater rate of 9.1 percent for properties valued between $100,000 and $300,000; 4.9 percent for properties valued between $300,000 and $750,000; and 4.7 percent of properties valued above $750,000.
- 11.7 percent of properties owned between 10 and 15 years were seriously underwater, the highest share of any five-year period up to 20 years. Only 7.2 percent of properties owned more than 20 years are seriously underwater.
- 19.2 percent of non-owner occupied (investment) properties with a mortgage were underwater as of the end of Q2 2017 compared to only 6.8 percent of owner-occupied properties.
Report methodology
The ATTOM Data Solutions U.S. Home Equity & Underwater report provides counts of residential properties based on several categories of equity — or loan to value (LTV) — at the state, metro, county and zip code level, along with the percentage of total residential properties with a mortgage that each equity category represents. The equity/LTV calculation is derived from a combination of record-level open loan data and record-level estimated property value data.
Definitions
- Seriously underwater: Loan to value ratio of 125 percent or above, meaning the homeowner owed at least 25 percent more than the estimated market value of the property.
- Equity rich: Loan to value ratio of 50 percent or lower, meaning the homeowner had at least 50 percent equity.
About ATTOM Data Solutions
ATTOM Data Solutions is the curator of the ATTOM Data Warehouse, a multi-sourced national property database that blends property tax, deed, mortgage, foreclosure, environmental risk, natural hazard, health hazards, neighborhood characteristics and other property characteristic data for more than 150 million U.S. residential and commercial properties. The ATTOM Data Warehouse delivers actionable data to businesses, consumers, government agencies, universities, policymakers and the media in multiple ways, including bulk file licenses, APIs and customized reports.
ATTOM Data Solutions also powers consumer websites designed to promote real estate transparency: RealtyTrac.com is a property search and research portal for foreclosures and other off-market properties; Homefacts.com is a neighborhood research portal providing hyperlocal risks and amenities information; HomeDisclosure.com produces detailed property pre-diligence reports.
ATTOM Data and its associated brands are cited by thousands of media outlets each month, including frequent mentions on CBS Evening News, The Today Show, CNBC, CNN, FOX News, PBS NewsHour and in The New York Times, Wall Street Journal, Washington Post, and USA TODAY.