
RETECHNOLOGY PREMIUM MARKETPLACE RELATED PRODUCTS | WEBINARS | SPECIAL OFFERS


You are viewing our site as an Agent, Switch Your View:
Agent | Broker Reset Filters to Default Back to ListBlack Knight's February Mortgage Monitor: Negative Equity Rates Improve, But Lowest-Priced Homes Continue to Struggle; "Serial Refinancers" Played Large Role in 2015 Refi Wave
April 04 2016
JACKSONVILLE, Fla., April 4, 2016 -- Today, the Data & Analytics division of Black Knight Financial Services, Inc. (NYSE: BKFS) released its latest Mortgage Monitor Report, based on data as of the end of February 2016. This month, in light of its recent reports on rising equity levels nationwide, Black Knight looked at those on the other end of the spectrum and found that as of the end of 2015, there were still 3.2 million borrowers in negative equity positions, representing $126 billion in underwater first and second lien housing debt. While negative equity rates continue to improve on the national level, the recovery is decidedly imbalanced in terms of both home price levels and geography. As Black Knight Data & Analytics Senior Vice President Ben Graboske explained, borrowers whose homes are in the lowest tier of home prices continue to struggle with high negative equity rates.
"Throughout 2015, the negative equity population in the U.S. decreased by over 30 percent, bringing another 1.5 million homeowners out from underwater on their mortgages," said Graboske. "However, even after four years of improvement, the recovery has not reached all corners. When we looked at the population by home price levels, we found that over half of the nation's underwater properties are in the lowest 20 percent of their respective markets. That's the highest share on record. In fact, while the national negative equity rate is now 6.5 percent, for homes in the lowest price tier, it's over 16 percent. Furthermore, this group is seeing a slower recovery than the nation as a whole. At the current rate of improvement, it would take more than five years for the negative equity rate in this lowest price tier to reach 2005 levels – roughly two-and-a-half years longer than homes in the top 20 percent."
The data also showed variation in negative equity improvement at the geographic level. In Nevada, where the Black Knight Home Price Index shows home prices still 34 percent below their peak, over 14 percent of borrowers are still underwater on their mortgages, the largest share in the nation. By volume, Florida leads the country with just under 500,000 underwater borrowers. Missouri was the only state to see its underwater population actually rise in 2015, due to falling home prices in the state.
This month, Black Knight also looked at recent refinance originations, finding that so-called "serial refinancers" played a large role in the rise and fall of refinance volumes throughout 2015 driven by interest rate fluctuations. Rate/term refinances from borrowers who had held their prior mortgages for less than two years jumped by 800 percent from Q1 2014 to Q1 2015 as interest rates dropped. Likewise, when rates rose toward the end of the year, this population dropped by nearly 65 percent, resulting in two-thirds of rate/term refinances in Q4 2015 stemming from borrowers who held their prior mortgages for more than four years. In addition, Black Knight found that term reductions have become an increasingly popular part of refinance transactions, with 37 percent of rate/term refinances in Q4 2015 including a term reduction. These two trends are linked, as term reductions are more popular among loans of a greater age, as those borrowers are understandably more hesitant to restart the clock on their mortgages. Finally, the data showed that $68 billion in equity was extracted via cash-out refinance transactions in 2015 -- the most since 2009 and a 53 percent increase over 2014. Cash-out refinance borrowers continue to represent a relatively low risk profile for lenders; the average post-cash-out LTV is 67 percent, with an average credit score of just under 750.
As was reported in Black Knight's most recent First Look release, other key results include:
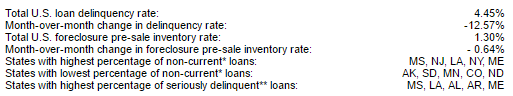
*Non-current totals combine foreclosures and delinquencies as a percent of active loans in that state.
**Seriously delinquent loans are those past-due 90 days or more.
Totals are extrapolated based on Black Knight Financial Services' loan-level database of mortgage assets.
About the Mortgage Monitor
The Data & Analytics division of Black Knight Financial Services manages the nation's leading repository of loan-level residential mortgage data and performance information on the majority of the overall market, including tens of millions of loans across the spectrum of credit products and more than 160 million historical records. The company's research experts carefully analyze this data to produce a summary supplemented by dozens of charts and graphs that reflect trend and point-in-time observations for the monthly Mortgage Monitor Report. To review the full report, visit: http://www.BKFS.com/CorporateInformation/NewsRoom/Pages/Mortgage-Monitor.aspx
About Black Knight Financial Services, Inc.
Black Knight Financial Services, Inc. (NYSE: BKFS), a Fidelity National Financial (NYSE:FNF) company, is a leading provider of integrated technology, data and analytics solutions that facilitate and automate many of the business processes across the mortgage lifecycle.
Black Knight Financial Services is committed to being a premier business partner that lenders and servicers rely on to achieve their strategic goals, realize greater success and better serve their customers by delivering best-in-class technology, services and insight with a relentless commitment to excellence, innovation, integrity and leadership. For more information on Black Knight Financial Services, please visit www.bkfs.com.