
RETECHNOLOGY PREMIUM MARKETPLACE RELATED PRODUCTS | WEBINARS | SPECIAL OFFERS


You are viewing our site as an Agent, Switch Your View:
Agent | Broker Reset Filters to Default Back to ListLuxury Housing is Hot, Hot, Hot
July 12 2018
$1 million-plus sales are up 25 percent; Demand rising on West Coast, Denver, Nashville; Stalling in New York City area
SANTA CLARA, Calif., July 12, 2018 -- Luxury home sales and prices are surging, according to the realtor.com® June 2018 Luxury Home Index released today. The Index reveals $1 million plus home sales are up 25 percent, despite the fact it costs on average 4.6 percent more to enter the high-end market this year compared to last year*.
The index analyzes the entry-level luxury price tier, defined as the top 5 percent of all residential sales, in 91 U.S. counties.
"Continued growth in high paying jobs and stock market inertia have reignited many luxury markets this year," said Javier Vivas, director of economic research for realtor.com®. "We've seen a substantial increase in buyer demand for high-end homes -- even with prices and costs of ownership swiftly on the rise."
Nationally, luxury home prices and demand continue to rise
In the 91 luxury markets analyzed, the entry-level price for luxury increased an average of 4.6 percent year-over-year. Some markets continue to grow at a breakneck pace; 17 of the 91 luxury markets are now seeing more than 10 percent price growth year-over-year.
The pace of sales in the luxury segment continues to break last year's records, too. The combined median age of inventory in the 91 luxury markets was 105 days, down 7 days or 6.5 percent year-over-year. Additionally, two thirds of luxury markets are seeing inventory move faster than last year.
$1 million plus is new norm for luxury homes
In 51 of the 91 markets analyzed, the luxury home tier currently has an entry point of at least $1 million. The number of sales at or above the $1 million mark in the 91 markets is also up 25 percent over last year. That is the biggest jump observed since January 2014, and two and half times the pace observed this January.
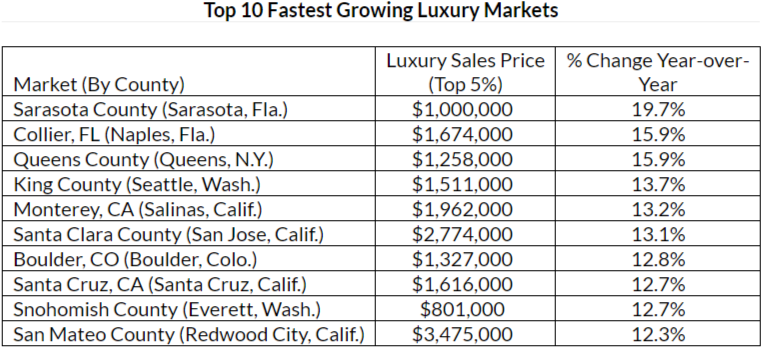
Luxury prices along the Northern California coast accelerate
The region now has four of the top 10 fastest-growing luxury markets in the country, indicating that the booming tech sector and strong foreign interest are pushing demand for luxury properties to new heights. Bay Area markets of Santa Cruz, San Mateo, Santa Clara, and Monterey have all been growing at an accelerating pace, with entry-level luxury prices now up 12-14 percent year-over-year.
Demand extends for luxury homes in Denver, Seattle and Nashville areas
Denver's boom has extended further outward, with Boulder, Douglas and Denver counties all seeing double-digit annual price growth in the luxury tier. The median days on market for luxury properties in these three counties is 89 days, also down 15 percent year-over-year.
In the Pacific Northwest, the entry-level luxury price in Seattle area's King County and the further outlying Snohomish County is up 13 percent year-over-year. The median days on market of luxury properties in these two counties is now a combined 48 days, down 3 percent year-over-year on average. Snohomish is currently the fastest-moving luxury market in the country.
In Nashville's Williamson and Davidson counties, the median days on market for luxury properties is now 71 days, down 12 percent year-over-year on average.
Jersey City and Queens luxury markets buck the Northeast stall
Most markets in New York and New Jersey continue to see luxury prices stall or remain stationary. The Hudson, N.J. (Jersey City) and Queens, N.Y. markets remain the exception, and both continue to see well above average, double-digit price growth. These two markets offer a lower luxury entry point compared with Manhattan and Brooklyn, where growth remains stagnant. The median days on market of luxury properties in Hudson and Queens combined is 66 days, down 29 percent year-over-year.
For more information, click here.
Methodology
Realtor.com® Luxury Home Index analyzes 91 luxury counties, looking at yearly movement in the entry-level luxury price boundary, defined as the top 5 percent of all residential home sales in a given market in April 2018. The following markets were excluded from rankings this month as we review their data: Washoe, Nevada; Lake, Ill.; Dallas; and St. Louis. Age of inventory figures are median days on market for the top 5 percent of inventory based on asking prices in June 2018.
*As measured by the cost to purchase a home in the top 5 percent in one of the 91 luxury markets studied.
About realtor.com®
Realtor.com®, The Home of Home SearchSM, offers the most comprehensive source of for-sale MLS-listed properties, among competing national sites, and access to information, tools and professional expertise to help people move confidently through every step of their home journey. It pioneered the world of digital real estate 20 years ago, and today is the trusted resource for home buyers, sellers and dreamers by making all things home simple, efficient and enjoyable. Realtor.com® is operated by News Corp [NASDAQ: NWS, NWSA] [ASX: NWS, NWSLV] subsidiary Move, Inc. under a perpetual license from the National Association of REALTORS®. For more information, visit realtor.com®.