
RETECHNOLOGY PREMIUM MARKETPLACE RELATED PRODUCTS | WEBINARS | SPECIAL OFFERS


You are viewing our site as an Agent, Switch Your View:
Agent | Broker Reset Filters to Default Back to ListU.S. Foreclosure Activity Decreases 19 Percent in Q1 2018 to Stay Below Pre-Recession Levels for Sixth Consecutive Quarter
April 13 2018
But Foreclosure Starts Up From Year Ago in 37 Percent of Local Markets; Foreclosure Rate on 2014 Vintage FHA Loans Rises Above Long-Term Average; Average Foreclosure Timeline Drops 23 Percent From Previous Quarter
IRVINE, Calif. – April 12, 2018 — ATTOM Data Solutions, curator of the nation's premier property database, today released its Q1 2018 U.S. Foreclosure Market Report, which shows a total of 189,870 U.S. properties with a foreclosure filing during the first quarter of 2018, up 4 percent from the previous quarter but still down 19 percent from a year ago and 32 percent below the pre-recession average of 278,912 per quarter from Q1 2006 to Q3 2007 — the sixth consecutive quarter where U.S. foreclosure activity has been below its pre-recession quarterly average.
The report also shows a total of 74,341 U.S. properties with foreclosure filings in March 2018, up 21 percent from an all-time low in the previous month but still down 11 percent from a year ago — the 30th consecutive month with a year-over-year decrease in U.S. foreclosure activity.
An analysis of foreclosure activity by loan origination year shows that 45 percent of all properties in foreclosure as of the end of the first quarter were tied to loans originated between 2004 and 2008, down from 50 percent as of the end of Q4 2017 and down from 51 percent as of the end of Q1 2017.
"Less than half of all active foreclosures are now tied to loans originated during the last housing bubble, one of several data milestones in this report showing that the U.S. housing market has mostly cleared out the backlog of bad loans that triggered the housing and financial crisis nearly a decade ago," said Daren Blomquist, senior vice president at ATTOM Data Solutions. "Meanwhile we are beginning to see early signs that some post-recession loan vintages are defaulting at a slightly elevated rate, a sign that some loosening of lending standards has occurred in recent years. Consequently, foreclosure starts are trending higher compared to a year ago in an increasing number of local markets — some of which are a bit surprising given the overall strength of housing in those markets."
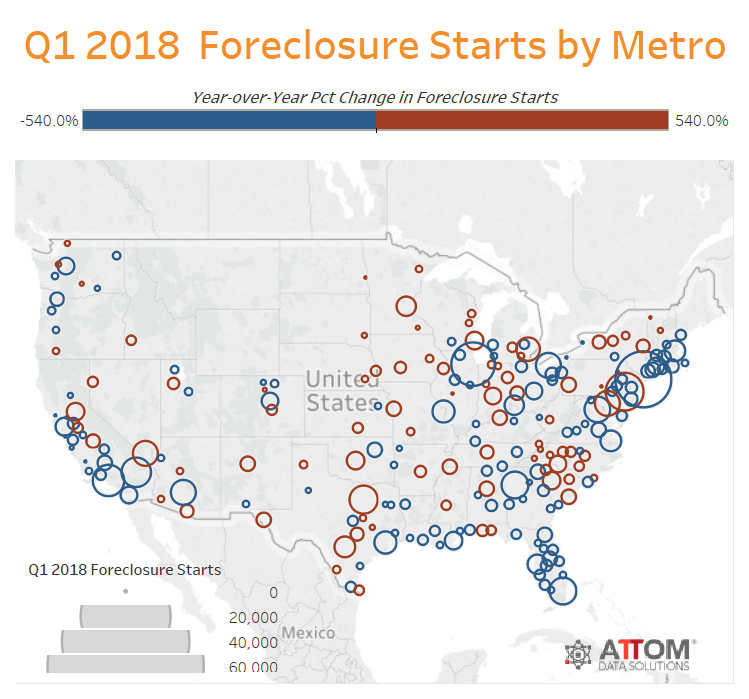
Foreclosure starts increase in 37 percent of local markets
A total of 92,703 U.S. properties started the foreclosure process in Q1 2018, up 8 percent from the previous quarter but still down 10 percent from a year ago — the 11th consecutive quarter with a year-over-year decrease in U.S. foreclosure starts.
Counter to the national trend, 82 of 219 metropolitan statistical areas analyzed in the report (37 percent) posted year-over-year increases in foreclosure starts in the first quarter, up from 20 percent of markets posting year-over-year increases in foreclosure starts in Q1 2017.
Twenty-three of 53 metropolitan statistical areas with at least 1 million people (43 percent) posted a year-over-year increase in foreclosure starts in the first quarter, led by Indianapolis, Indiana (up 148 percent); Minneapolis-St. Paul, Minnesota (up 64 percent); Louisville, Kentucky (up 36 percent); Austin, Texas (up 30 percent); and Oklahoma City, Oklahoma (up 23 percent).
Other markets posting double-digit percentage increases in foreclosure starts in Q1 2018 compared to a year ago were Milwaukee (up 21 percent) Dallas-Fort Worth (up 20 percent), San Antonio (up 17 percent), Las Vegas (up 15 percent), Birmingham, Alabama (up 13 percent), Charlotte (up 12 percent), Pittsburgh (up 12 percent), Raleigh (up 10 percent) and Nashville (up 10 percent).
Bank repossessions down in 46 states and DC
Lenders repossessed 65,413 U.S. properties through foreclosure (REO) in Q1 2018, down 2 percent from the previous quarter and down 28 percent from a year ago — the eighth consecutive quarter with a year-over-year decrease in U.S. REOs.
Along with the District of Columbia, 46 states posted year-over-year decreases in REOs in the first quarter, including Florida (down 33 percent); New Jersey (down 24 percent); Texas (down 20 percent); Illinois (down 41 percent); California (down 36 percent); and Maryland (down 34 percent).
"Maryland's housing market continues its stride to recovery, posting successive growth indicators since 2012," said Bernice E. Mensah, director of housing and economic research at the Maryland Department of Housing and Community Development. "The state's tightening housing market due in large part to sustained low unemployment rate, rising home prices, shrinking inventory of homes along with growing median income has helped turn the tide on foreclosure activity to its lowest level since Q3 2012. This has encouraged lenders to speed up their foreclosure processing to take advantage of growing home prices and clear up the foreclosure pipeline."
Foreclosure activity below pre-recession levels in 56 percent of local markets
Twenty-two states posted first quarter foreclosure activity totals below their pre-recession averages, led by Colorado, Michigan, California, Nevada and Georgia. Twenty-eight states and the District of Columbia posted first quarter foreclosure activity totals above their pre-recession averages, including New Jersey, New York, Pennsylvania, North Carolina and Maryland.
First quarter foreclosure activity registered below pre-recession levels in 122 of the 219 metropolitan statistical areas analyzed in the report (56 percent), including Los Angeles, Chicago, Dallas-Fort Worth, Houston, and Miami.
First quarter foreclosure activity continued to register above pre-recession levels in 97 of the 219 metro areas analyzed in the report (44 percent), including New York-Northern New Jersey, Philadelphia, Washington, D.C., Baltimore and Virginia Beach, Virginia.
Atlantic City, Trenton, Philadelphia post highest metro foreclosure rates in Q1 2018
Nationwide one in every 706 U.S. housing units had a foreclosure filing in the first quarter of 2018. States with the highest foreclosure rates in the first quarter were New Jersey (one in 233 housing units with a foreclosure filing); Delaware (one in 317); Maryland (one in 385); Illinois (one in 425); and South Carolina (one in 458).
Among 219 metropolitan statistical areas with a population of at least 200,000, those with the highest foreclosure rates in Q1 2018 were Atlantic City, New Jersey (one in every 113 housing units with a foreclosure filing); Trenton, New Jersey (one in 198); Philadelphia, Pennsylvania (one in 284); Columbia, South Carolina (one in 311); and Fayetteville, North Carolina (one in 321).
Along with Philadelphia, other major metros with a population of at least 1 million and foreclosure rates in the top 25 highest nationwide included Cleveland at No. 6, Baltimore at No. 10, Chicago at No. 11, Riverside-San Bernardino in Southern California at No. 20, New York-Northern New Jersey at No. 22, Birmingham, Alabama at No. 23, and Las Vegas at No. 25.
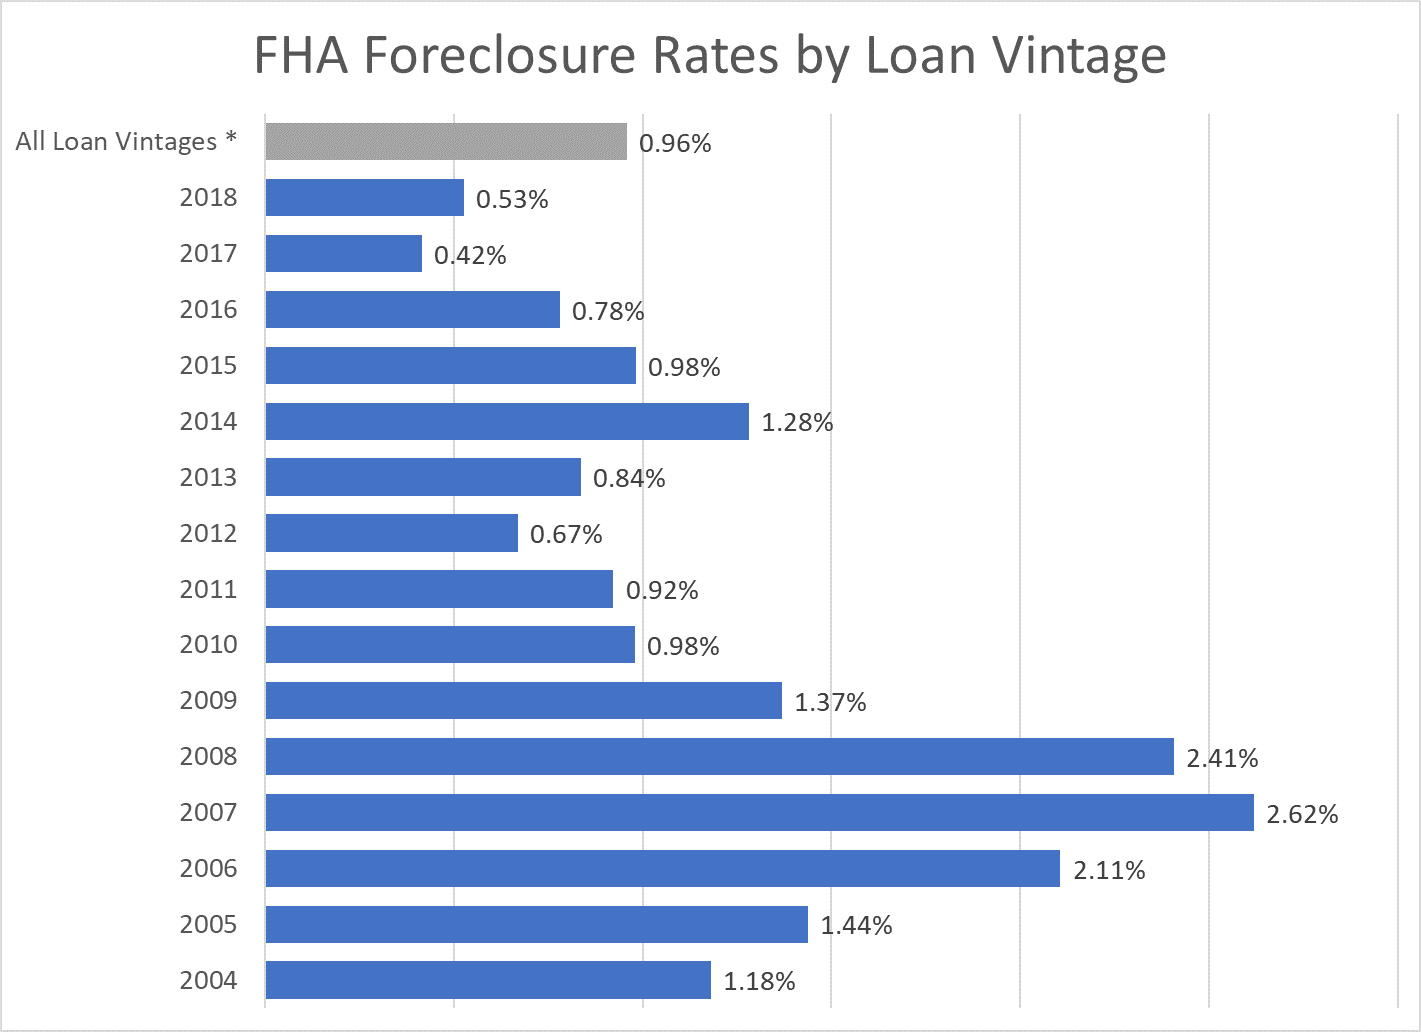
Foreclosure rate on 2014 vintage FHA loans above historical average
The report also broke down percentage of open loans in foreclosure by loan origination year (vintage). As of the end of the first quarter of 2018, 0.48 percent of all open U.S. loans secured by real property were actively in foreclosure across all loan vintages.
Loan vintages with the highest share of open loans in foreclosure were 2006 and 2007 (both with 1.52 percent) followed by 2005 (1.13 percent), 2008 (1.03 percent), and 2004 (0.85 percent). Among post-recession loan vintages originated in 2010 or later the highest share of open loans in foreclosure was for loans originated in 2014 (0.41 percent).
The report also analyzed the share of open loans backed by the Federal Housing Administration (FHA) in foreclosure by loan vintage. Nationwide for all loan vintages, 0.96 percent of open FHA-backed loans secured by real property were in foreclosure, with the 2014 loan vintage posting the highest share in foreclosure of any post-recession loan vintage (1.28 percent).
The 2014 loan vintage had the highest share of open FHA-backed loans in foreclosure among post-recession vintages in 54 of 109 (50 percent) metropolitan statistical areas with at least 10,000 active FHA-backed loans as of the end of the first quarter, including in Chicago, Dallas, Atlanta, Philadelphia and Phoenix.
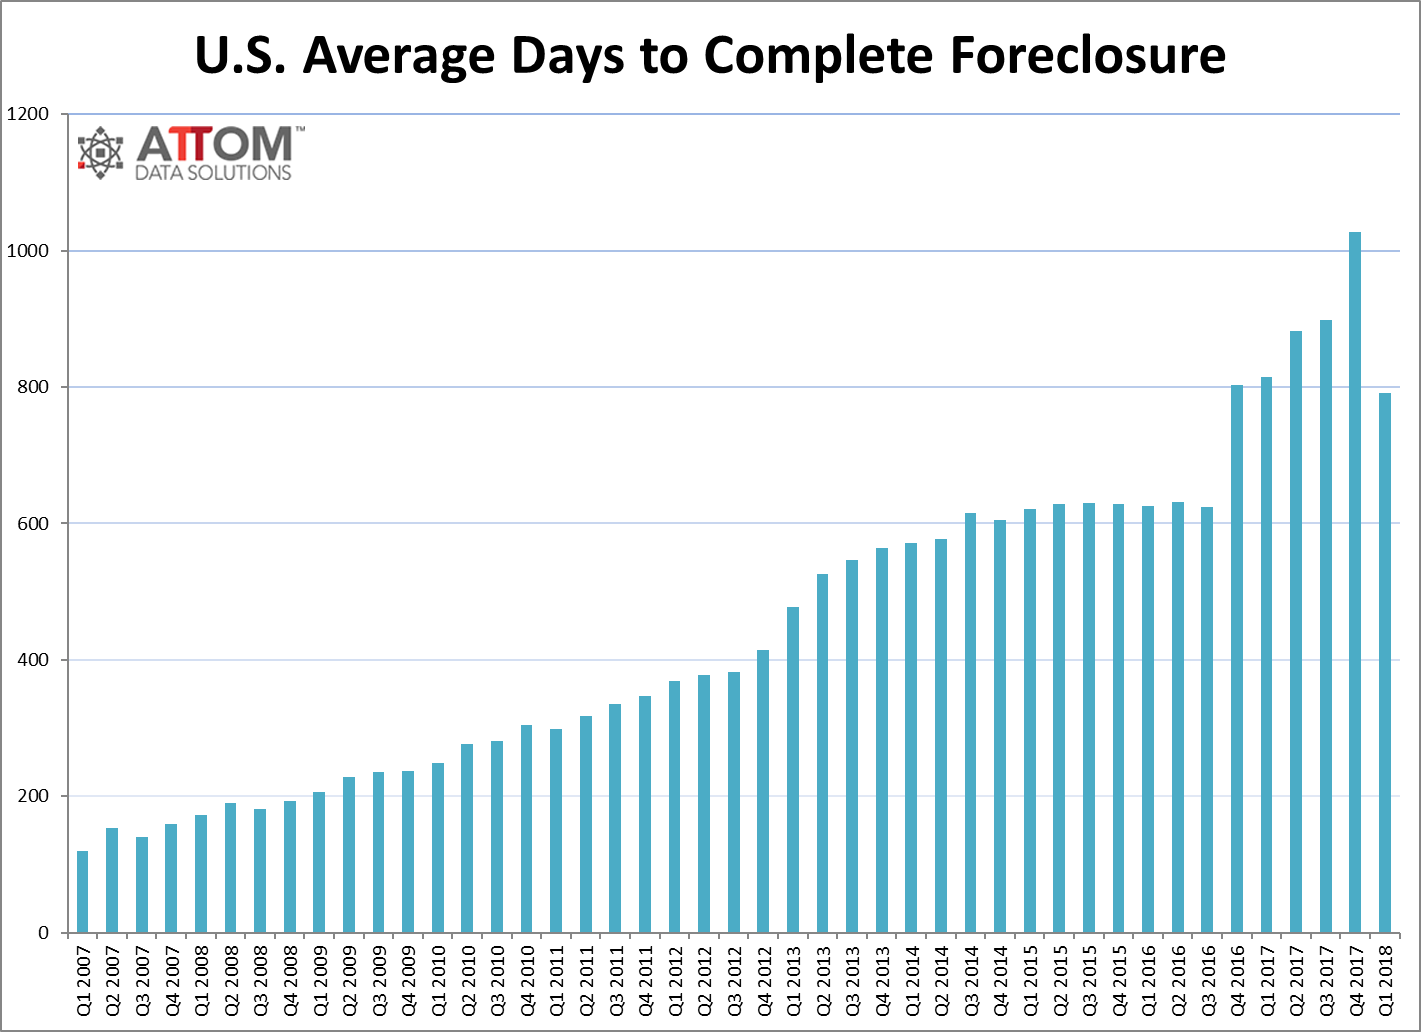
Average foreclosure timeline drops 23 percent in first quarter
Properties foreclosed in the first quarter of 2018 had been in the foreclosure process an average of 791 days, down 23 percent from an average 1,027 days for properties foreclosed in the fourth quarter of 2017 and down 3 percent from an average of 814 days for properties foreclosed in the first quarter of 2017.
States with the longest average foreclosure timeline for properties foreclosed in Q1 2018 were Nevada (1,765 days), Hawaii (1,584 days), Florida (1,247 days), Indiana (1,245 days), and New Jersey (1,182 days).
States with the shortest average time to foreclose in Q1 2018 were Virginia (193 days), Mississippi (212 days), Wyoming (252 days), West Virginia (270 days), and Arkansas (282 days).
About ATTOM Data Solutions
ATTOM Data Solutions blends property tax, deed, mortgage, foreclosure, environmental risk, natural hazard, and neighborhood data for more than 155 million U.S. residential and commercial properties multi-sourced from more than 3,000 U.S. counties. A rigorous data management process involving more than 20 steps validates, standardizes and enhances the data collected by ATTOM, assigning each property record with a persistent, unique ID — the ATTOM ID. With more than 29.6 billion rows of transactional-level data and more than 7,200 discrete data attributes, the 9TB ATTOM data warehouse powers real estate transparency for innovators, entrepreneurs, disrupters, developers, marketers, policymakers, and analysts through flexible delivery solutions, including bulk file licenses, APIs and customized reports.