
RETECHNOLOGY PREMIUM MARKETPLACE RELATED PRODUCTS | WEBINARS | SPECIAL OFFERS


You are viewing our site as a Broker, Switch Your View:
Agent | Broker Reset Filters to Default Back to ListHousing Markets – The Right Measure?
November 17 2014
 Back in June, we provided some context for Money.com's 12 Cities Where Homes are Flying Off the Market. With the leaves coming down, I went back to the numbers over some hot cider and football this past weekend. A lot has changed since then, from industry merger news to world crisis...so I wondered if the US housing numbers would tell a different story.
There are many ways to look at a market
And it's easy to argue about which statistics are the most meaningful. Some recent examples:
- Forbes.com's annual "America's Most Expensive Zip Codes" – current asking prices
- Zillow's "Top 10 Seller's Markets" – close price to list price analysis
- NAR's Economist Outlook – Case Shiller Index
- Money.com's look at Days On Market (for sold homes in a given time period)
To me, each of the above has its flaws – as does any model of course. The most obvious being:
Asking Prices (by ZIP code) – In the methodology, they note that when inventory is low, and there are fewer than 10 active listings in a ZIP, they exclude it. This excludes some of the hottest markets out there. Low active inventory can actually be a sign that the market is hot. But even in markets with plenty of listings (like NYC), listing prices can be misleading. The news here in NYC over the last few months is that sellers are over-pricing and buyers are letting the majority of properties sit.
Close to List price analysis – This seems pretty intuitive. If the closing prices are on average over asking, then you likely have a hot market. But, as the Listing price proponents will state: by the time to sale is recording, the information is outdated. And they are right – this analysis trails accepted offers by 60+ days in many markets. And, given the interplay between re-pricing and days on market (neither considered here), you may be excluding some significant discounts.
Case-Shiller – Well, there's been lots written here from how it can focus only on the lowest tier of the market and overstates appreciation in an improving market.
Money.com - What about the homes that didn't sell? Maybe a segment of the market is hot while the rest is languishing (this was our perspective in June when we looked at the unsold market).
It should be clear that evaluating the market is more complex than looking at a single stat. (HINT – combine days on market with the listing prices and close to list price analysis perhaps?)
So, just to add some more fuel to the fire, we looked at Days On Market for those listings that did not sell (yet). It of course is yet another single stat, and suffers the same narrow vision...but it is interesting. And now, with 3+ quarters of the year under our belts, we have more to look at.
Unsold Days On Market
Why is this an interesting stat?
All of the other stats focus on what's selling. By focusing on what isn't (or really what's left, by time period), we can see the drag on the market. When we see big deltas between unsold and sold DoM, we can intuit that there are multiple market segments performing very differently.
Why don't more people focus on this?
Good question. It's definitely not as sexy. But it also requires clean and current data. Anyone following listing syndication knows that currency and accuracy of listing data is a hot button topic. And, of course, DoM has bias issues, too. What happens when an agent plays the de-list / re-list game (taking a property off market and then relisting it with a new ID#)? And, like current listing prices, we're just looking at today's inventory. Hopefully, we're doing that in a manner that provides some insight into the market over time. But it's not perfect. And our analysis limited to areas for which Onboard's clients currently access through our IDX web service (notably missing are Seattle and NYC).
So, what did we find?
We looked at homes listed in 2014 and still on the market. Below is a breakdown of the % of currently active 2014 listings still in inventory by listed time period. And we focused on the same "top markets" from back in June and contrasted them against a universe of 84 major markets in our inventory.
Active Inventory by Listed Date
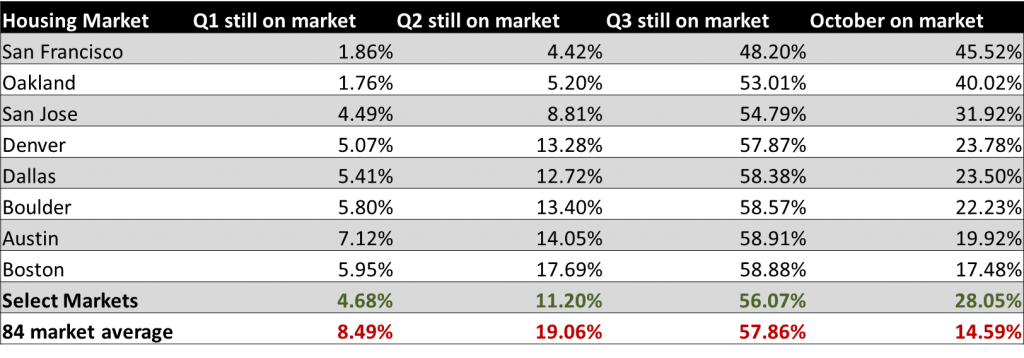
San Francisco / Oakland are hot across all listings – showing nearly complete sell-through of early year listings with only ~5% to 7% of 2014 inventory listed prior to 3rd quarter. Other markets have as much as 20% – 25% of 1st half listings still on market. And these hot markets outperform the 84 market index dramatically in the early part of the year. However, the gap narrows in Q3.
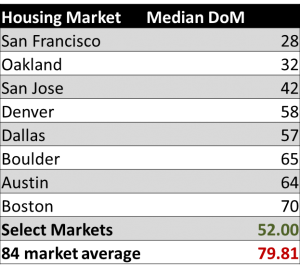
Median Days on Market
Drilling into days on market, we find an incredibly low median DoM of 28 and 32 days for the Bay Area markets. This means 30 days from list contract. Once we leave that market, we double the DoM median. If SF isn't hot right now, what is? And this quick turn around on listings marketwide explains why Forbes was unable to find 10 listings in many of the hottest / priciest zip codes. As a group, the hot markets continue to outperform the full index.
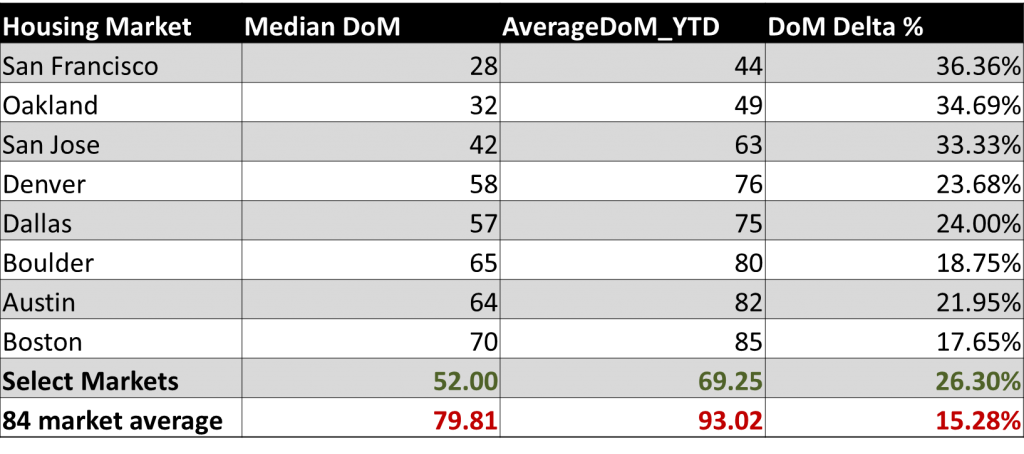
Variability in Days on Market
Looking a little deeper into DoM, we contrasted Median and Average Days on Market ("DoM Delta %"). Again, something interesting jumps out: The three Bay Area Markets also have contrasting deltas to the other markets and actually the highest differences on a percentage basis. Meaning that the slower selling homes in the Bay Area sell at a much slower comparative rate to their market than anywhere else.
The Delta is even more pronounced against the full 84 market index. What does this tell us? When average and median are close, your data is likely more homogeneous, with fewer outliers and a standard distribution. For these price comparisons, it means that, compared to the Bay Area, the other markets are seeing less of a gap between the homes that sell quickly and those that don't. We'd need to dive deeper, but this likely means that rather than quick and slow selling homes, most properties sell at a DoM closer to the middle range.
Which brings us back to our original point in June: a hot market isn't equally hot for everyone.
To view the original article, visit the Onboard Informatics blog.