
RETECHNOLOGY PREMIUM MARKETPLACE RELATED PRODUCTS | WEBINARS | SPECIAL OFFERS


You are viewing our site as an Agent, Switch Your View:
Agent | Broker Reset Filters to Default Back to ListGetting Started With Google Analytics – Part Two
September 10 2014
 In part one of Getting Started with Google Analytics, we talked about what's involved in getting it up and running on your website. Today we will discuss some of the important reports and metrics that it will provide you with. These reports and metrics give you the insight needed to refine or adjust your practices so that your website is meeting your goals and serving its purpose.
While Google offers customization options for your dashboard, most will include the following metrics: Sessions, Users, Pageviews, Pages/Session, Avg. Session Duration, Bounce Rate and % New Sessions. When looking at these metrics, you can segment and analyze a certain date range to see if any practices you put in place are correlated to a change in the amount of traffic that has reached your website or a change in how users interact with your website.
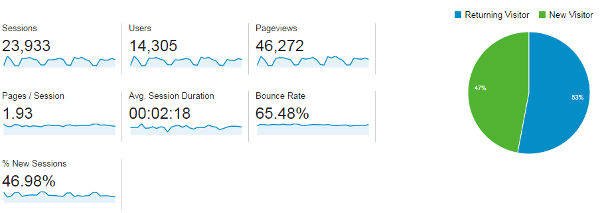
Sessions
A session is recorded when a user visits your website. Sessions are not unique and a percentage of your sessions can come from users visiting your website more than once. Sessions are a great indicator of how well your site is doing, and growth in the amount of sessions can signify that the practices you put in place in previous months are a success.
Users
This is the amount of unique visitors that your site receives during a set date range. This number isn't entirely accurate because Google doesn't know if a particular person visited your site from multiple devices, like their laptop, work computer, tablet or phone, but it does give you an idea of potentially how many individuals your website has had an impression on.
Pageviews
Pageviews give you an idea of how much users are interacting with your site when they visit. A pageview is registered every time a page loads on your website. If a user lands on your site and bounces, one pageview will be recorded. If a user lands on your website and views four properties, five pageviews will be recorded. One for the homepage, and one for each of the properties.
Pages/Session
Tells you, on average, how many pages a user views when they come to your site. Each website has a different layout, and perhaps your website is designed to provide more information by scrolling as opposed to linking. It's important to remember your personal goals and take into consideration site design before concluding whether your efforts were successful or unsuccessful.
Avg. Session Duration
This will tell you how long people are spending on your website. Generally speaking, the more time that a user's spends on your website the better. This means that what they are finding is useful to them and a worthwhile use of their time in relation to the endless other things they could be doing on their device.
Bounce Rate
This gives you an idea of the amount of people who visited your site and only viewed one page. A high bounce rate indicates that your website may be giving off a poor first impression. Maybe your homepage is overwhelming? Maybe the design isn't optimal? Maybe it's designed so users get all of the information they need on the homepage? This is where making changes and analyzing the data will really help you create a better website
In part three of Getting Started with Google Analytics, we will talk about how users are getting to your website (search, direct, referral etc.) and what this data can tell you!
To view the original article, visit the Lone Wolf blog.