
RETECHNOLOGY PREMIUM MARKETPLACE RELATED PRODUCTS | WEBINARS | SPECIAL OFFERS


You are viewing our site as an Agent, Switch Your View:
Agent | Broker Reset Filters to Default Back to ListInfographic: The Price is Right!
June 25 2012
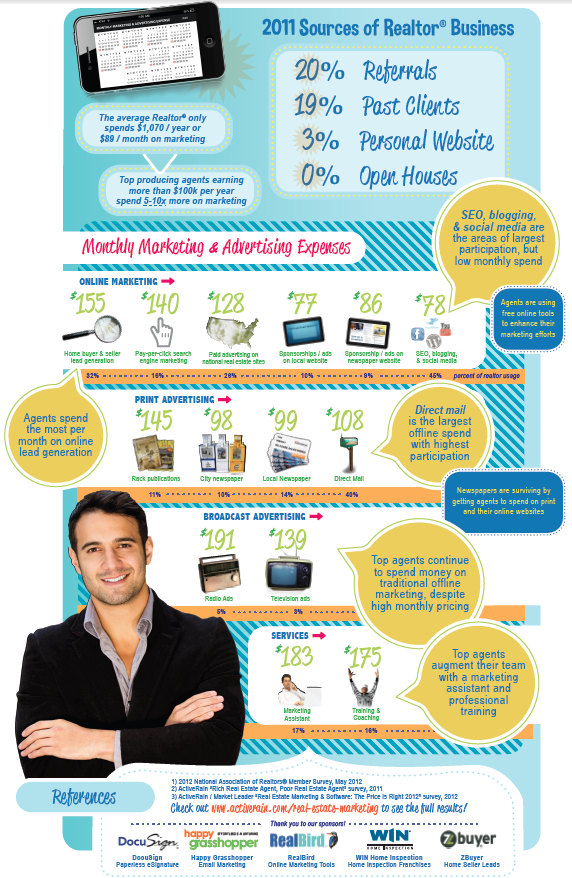
Our friends at ActiveRain and Market Leader created this gorgeous infographic to demonstrate where real estate agents are spending their money – and where it should be going. Data for the infographic came from a survey of more than 2,000 real estate agents as well as information from the 2012 National Association of REALTORS® Member survey.
So, without further ado, here’s the infographic. We’ll share some of the highlights on the next page.

Interesting Facts
The infographic covers a lot, but here are some of the things that we found most interesting.
- The biggest REALTOR® expense are cars! At about $1,770/year this accounts for 39% of the total annual budget and is 65% more than they’re spending on marketing.
- The average REALTOR® spends $630/year on technology.
- How many leads did your website generate in 2011? If you’re like most REALTORS®, it was only 4! That’s up from 3 leads in 2010, but still not where it should be. I can’t think of any stronger argument for investing in a strong, user-friendly website with IDX.
- So, if not from their website, where are most REALTORS® getting their leads? 20% come from referrals, 19% are past clients, 3% are generated by a personal website and (drumroll) 0% come from open houses.
- In terms of marketing and advertising expenses, online marketing is a heavy area of spending with lead generation as the priciest activity ($155/month). PPC ads are a close second ($140) and paid advertising follows up at ($128).
Our thanks again to ActiveRain and Market Leader for sharing this infographic.