
RETECHNOLOGY PREMIUM MARKETPLACE RELATED PRODUCTS | WEBINARS | SPECIAL OFFERS


You are viewing our site as an Agent, Switch Your View:
Agent | Broker Reset Filters to Default Back to ListMarket Trends and Housing Stats Now Available in RPR Mobile
April 16 2023
 Last year, RPR (Realtors Property Resource) unveiled a fantastic resource for REALTORS®: the Market Trends charts and graphs.
This collection of hyper-local housing stats is designed to help you inform your clients about local real estate market trends, info and indicators. It's also great for positioning yourself as a local market expert. (Check out these articles for details: RPR Unveils New Charts and Graphs in its Neighborhood Pages and Future Proof Your Business by Knowing Your Market and Your Numbers.)
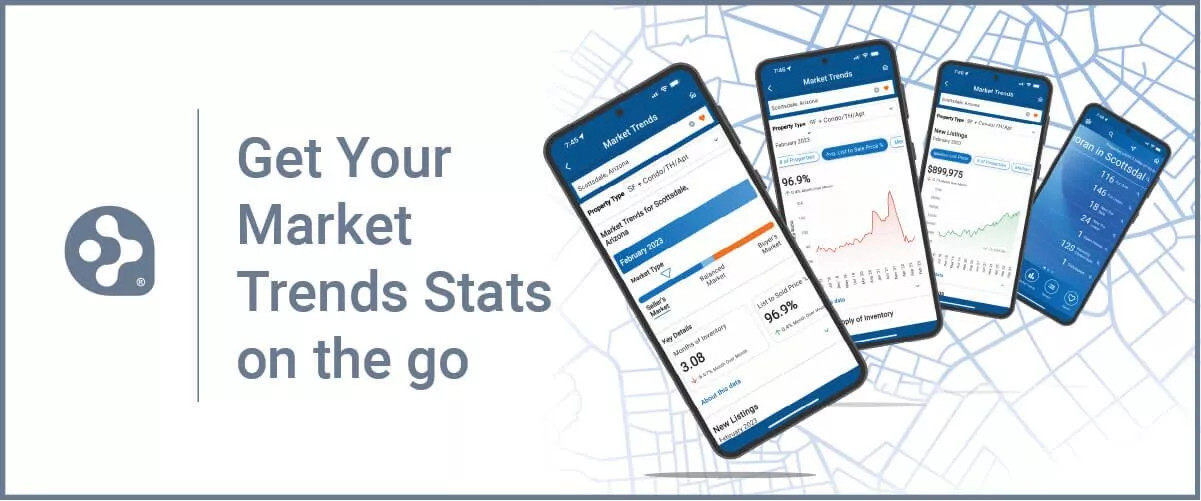
And now… (drum roll) the Market Trends charts and graphs are available on the RPR Mobile™ app!
Keep clients informed with hyper-local market updates
Access to Market Trends and Housing Stats through the RPR Mobile app makes it easier for REALTORS® to stay up-to-date on market trends even when they are on the go.
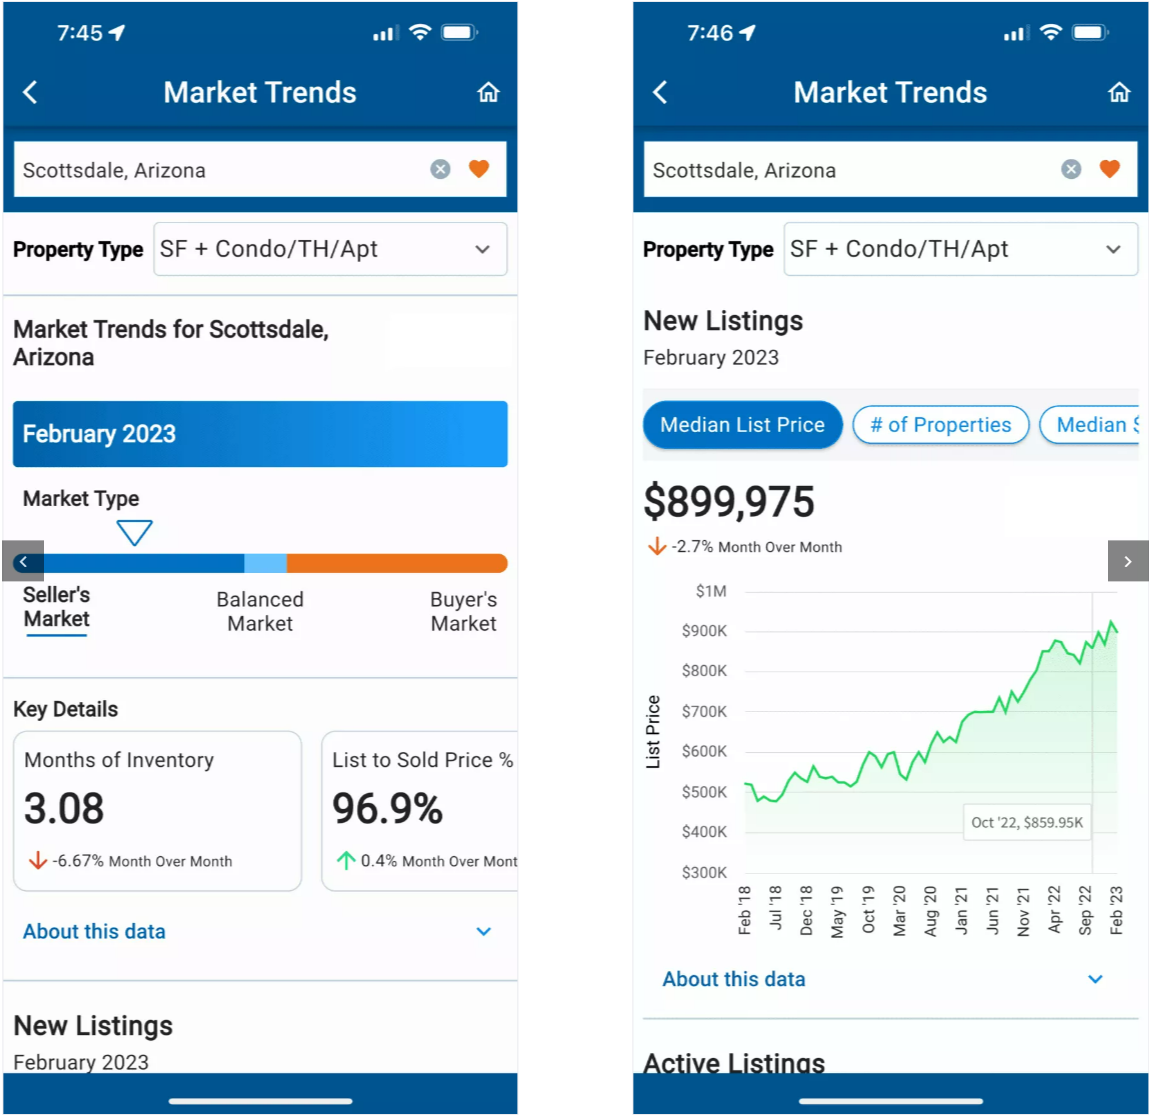
You can quickly access Months of Inventory, List-to-Sold Price Percentage, Median Days in RPR, and Median Sold Price from your mobile device. Best of all, they're conveniently grouped by each status: New Listings, Active Listings, New Pending Listings, Pending Listings, and Sold Listings. This can help your clients make informed decisions and provide better service by being able to respond quickly to changes in the market.
- Use all these metrics to assess and analyze the current state of the housing market in their area.
- You can use this information to advise your clients on a pricing strategy, offer strategies, and market conditions.
- You can also use it to identify trends that may affect future buying or selling decisions. For example, if there is a low inventory of homes for sale and high demand, you may advise a seller to list their home at a higher price point knowing that there are likely to be multiple offers. Alternatively, you may advise a buyer to act quickly when a new property is listed because you know that competition will be fierce.
How to find Market Trends on the RPR Mobile™ App
To find the charts, open up your RPR app (after updating it, of course) and look towards the bottom of the home screen. There is now a new Market Trends icon!
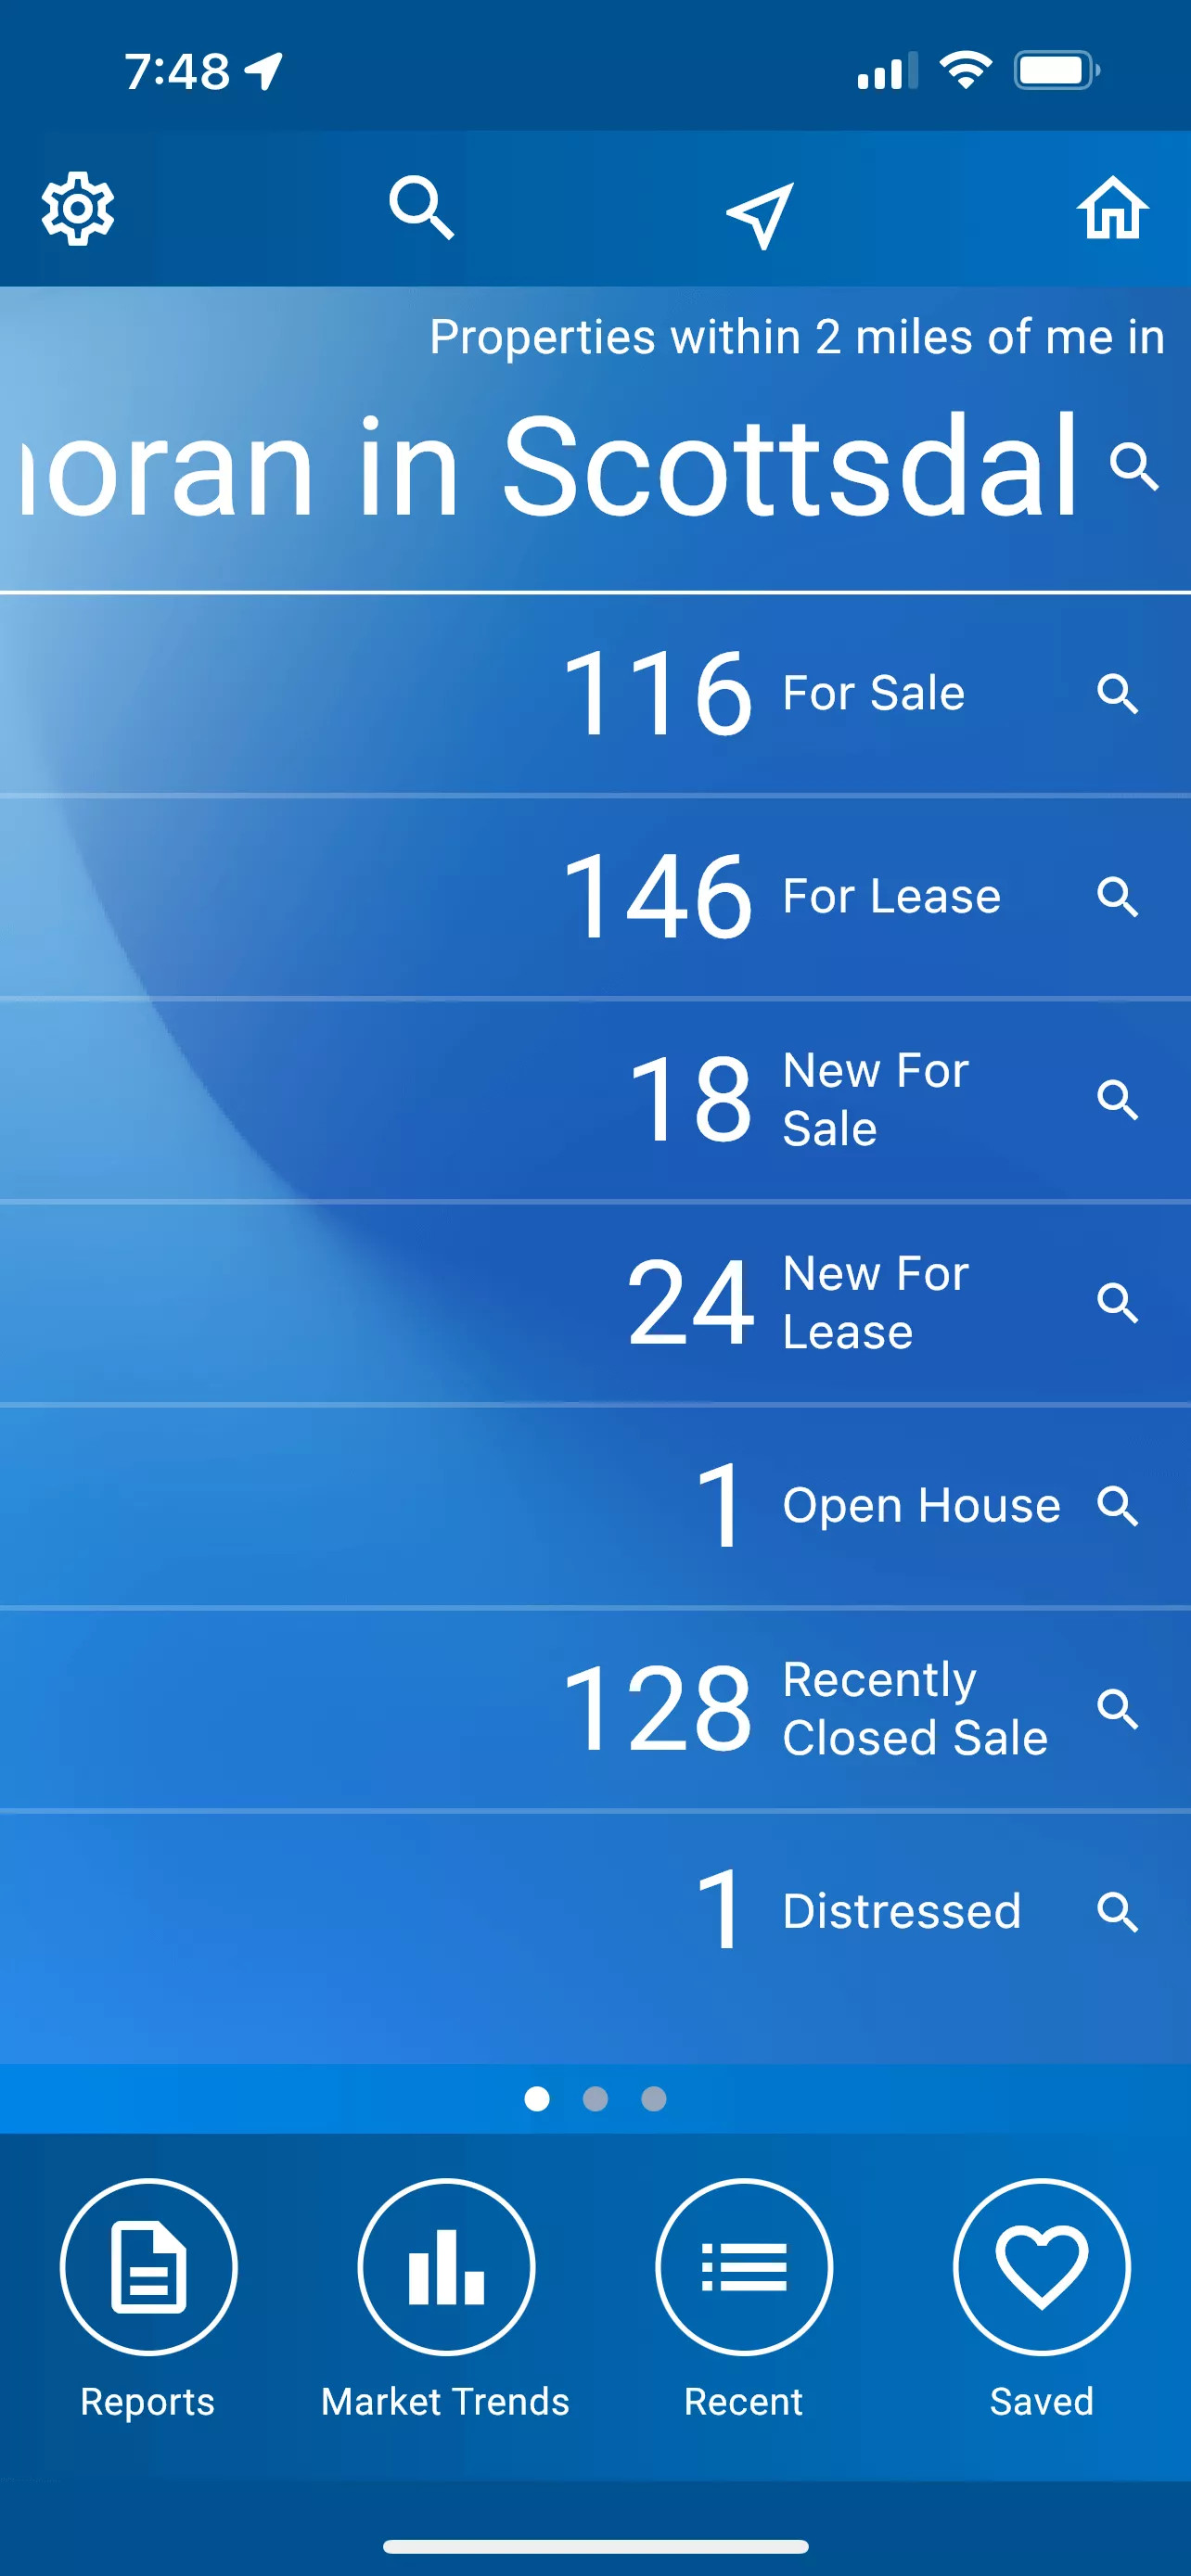
Click the tab to access a variety of market statistics, similar to the Market Trend tools on the RPR website. Be aware that the Market Trends will open to the geography that the user is currently in. To change it, type in a new neighborhood, ZIP or city.
- Pro Tip: If you're searching a neighborhood or area with little to no recent transactions, there will not be enough data for a chart to be offered. For the transaction-based charts, RPR needs at least three transactions within a calendar month. If no data appears on a chart or the "Updated" date is not what you expected, try searching within a larger area or select a different Property Type.
The chart options will include:
- New Listings
- Active Listings
- New Pending Listings
- Pending Listings
- Sold Listings
- Sold Public Records
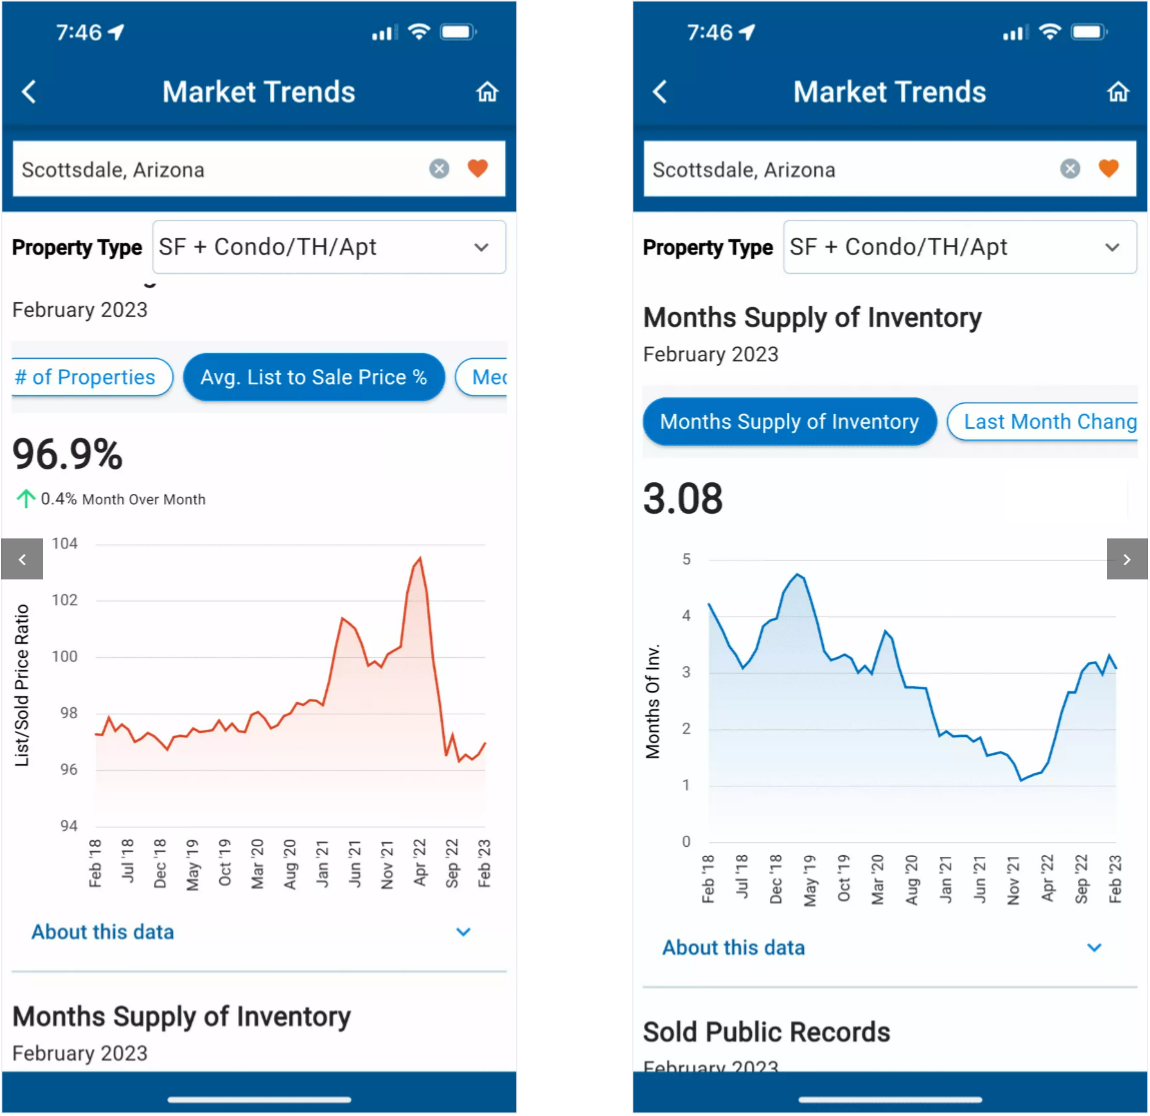
- Months Supply of Inventory
- Median Estimated Property Value
You'll also be able to view a variety of metrics for all property statuses and property types. And filters allow you to break down statistics by individual property types as well.
- Tip: You can also "Save" markets by tapping the heart icon.
RPR Market Trends and stats: up-to-date and on the go
If you haven't downloaded the RPR Mobile™app, do so now! The previous link will take you to an area within our blog where you can easily get to the App store (for iPhones) or Google Play (for Android devices).
Be sure to update and fire up your app or download it to your phone to get easy access to RPR's Market Trends and Housing Stats.
To view the original article, visit the RPR blog.