
RETECHNOLOGY PREMIUM MARKETPLACE RELATED PRODUCTS | WEBINARS | SPECIAL OFFERS


You are viewing our site as an Agent, Switch Your View:
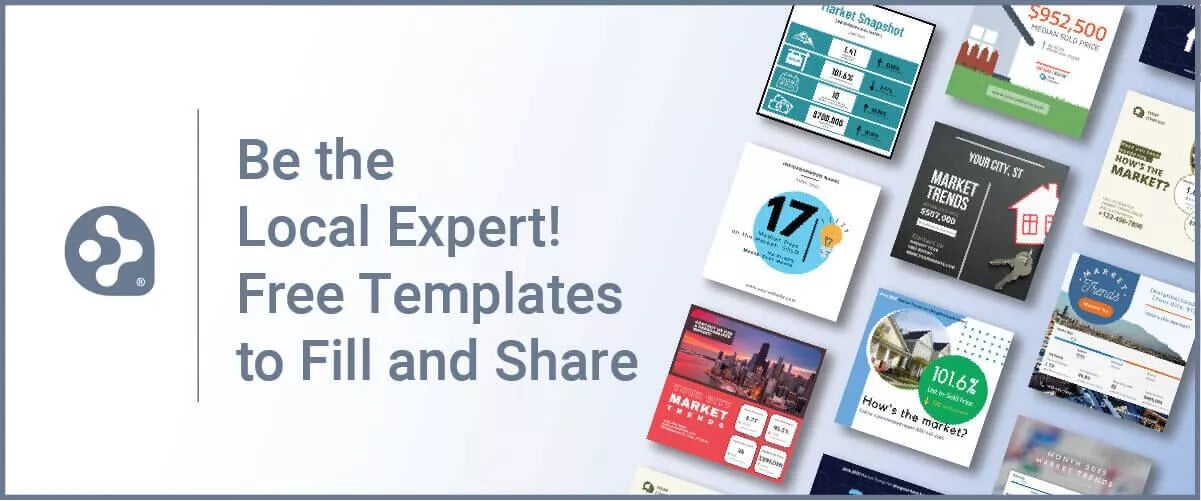
Agent | Broker Reset Filters to Default Back to ListFree Templates to Help you Create Social Media Market Updates
August 28 2022
 The media narrative during a changing market does little to instill confidence. Clickbaity headlines, based on national and regional statistics, speak to recession worries, a real estate bubble and even a real estate crash. However, if you take a step back and look closely at the data, it's clear there is much more of a story to tell.
Real estate is local, and it always has been. This is why as a real estate pro, you should use your social platforms to cut through the confusion and deliver expert local advice.
Facebook, Instagram, YouTube, and other media platforms are the perfect place to add your voice with local market insights to earn the trust of your followers. And to help on this sharing journey, RPR (Realtors Property Resource®) has the perfect solution: new housing market charts and graphs.
This collection of data, metrics and statistics is incredibly helpful in explaining local market trends. What market type are we currently in? Is housing inventory picking up? What are the month-to-month inventory changes? Are home prices softening? These are all questions your prospects and clients have on their minds.
Share Regular Market Updates to Cut Through the Confusion
RPR reporting is not always perfectly suited for sharing on social media. For starters, there can be too much data to share on your feed at any one time. Consider picking one or two data points and adding some context around them. And to make sharing easier, we've created a bunch of new templates that will cut your design time in half, and still come off looking polished and professional. We've created these templates in Canva so you can easily apply your colors, fonts, and even images when needed, to have aesthetics that match your brand.
The How-To: Creating and Sharing Market Updates
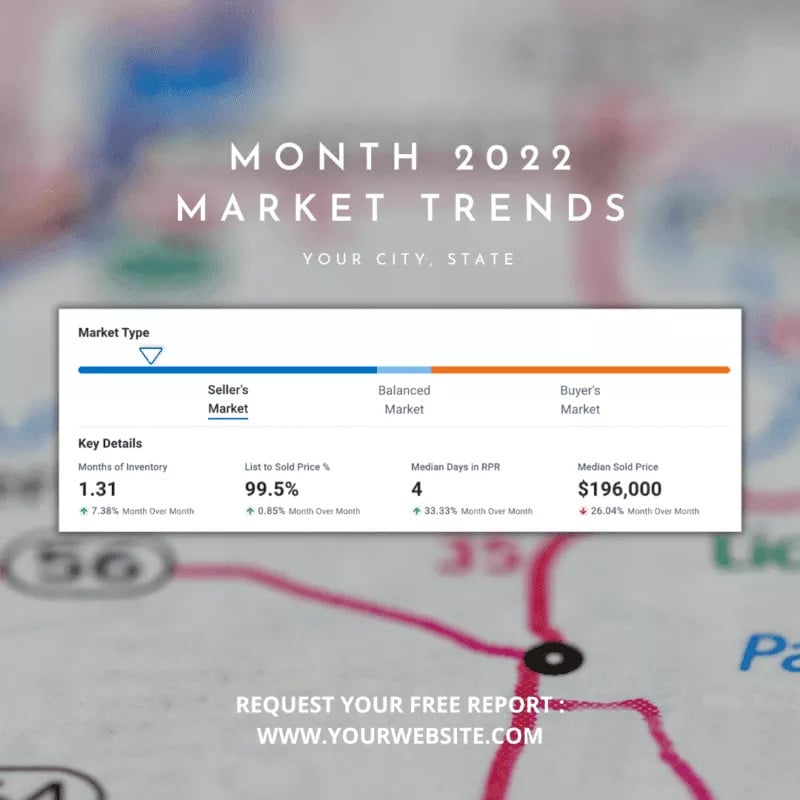
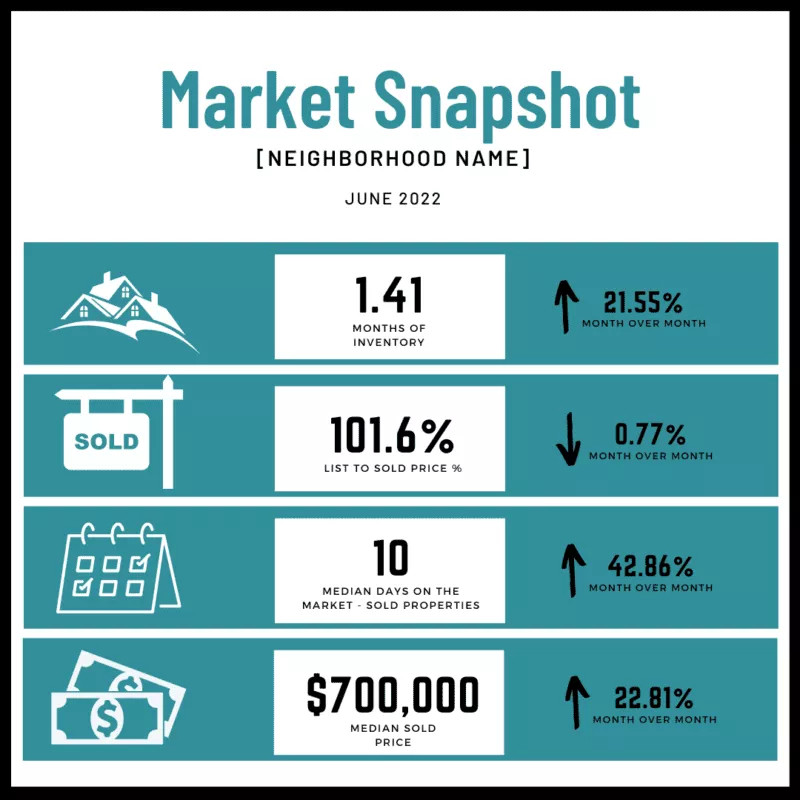
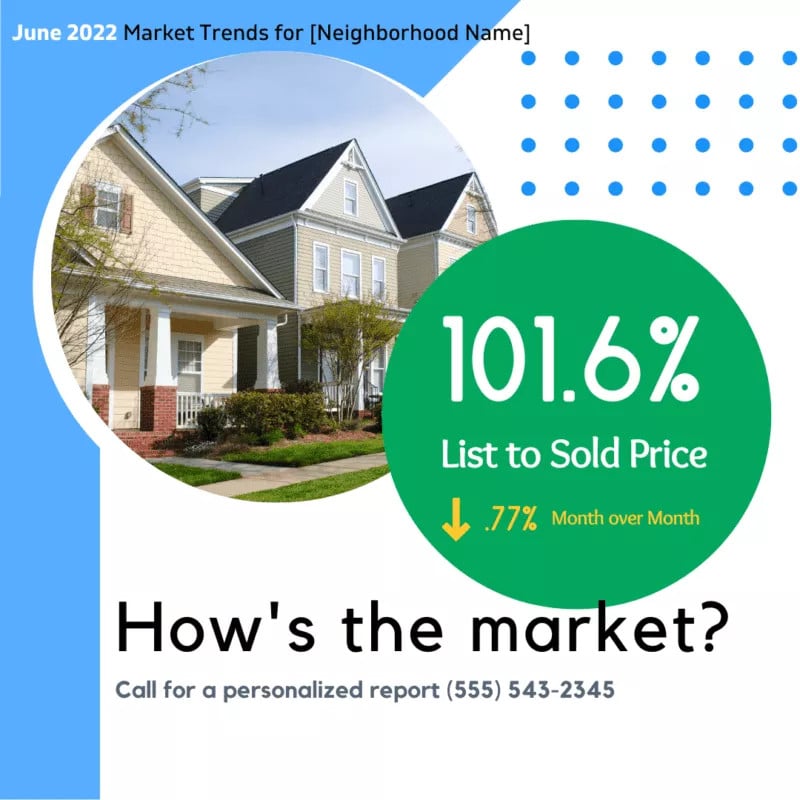
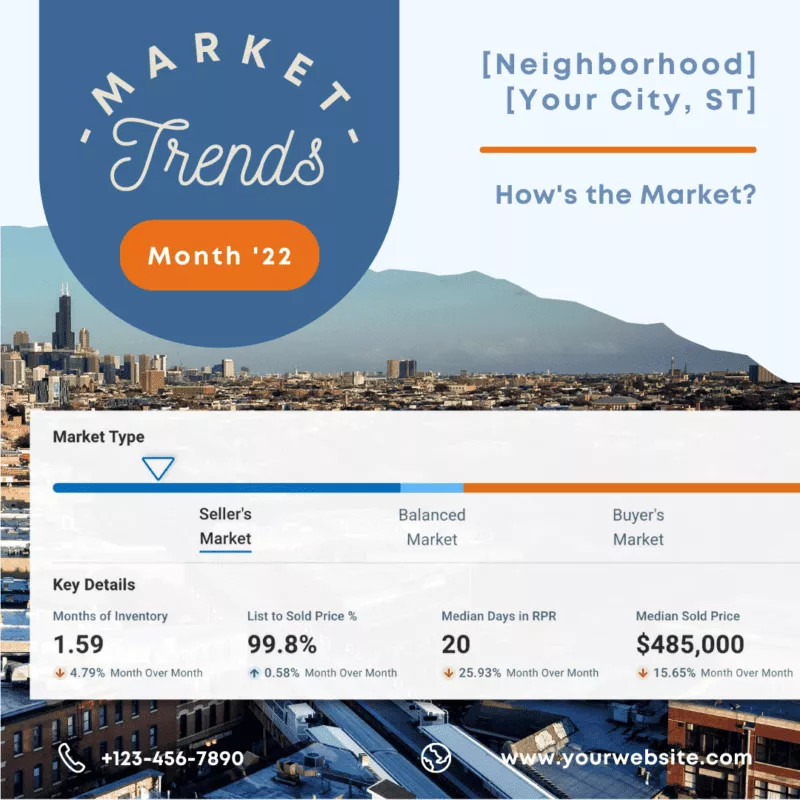
Found in RPR's Neighborhood pages, the new Market Trends chart helps to tell the underlying story of any market starting with the type of market (Seller, Balanced or Buyer), inventory trends, list-to-sold price ratio, median days on market, and the median sold price.
Moving over to the Housing tab, you'll get a granular view at what's driving your local market. Here you'll see the activity and trends are broken up by each key status: New Listings, Active Listings, New Pending Listings, Pending Listings, and Sold Listings. Rounding out this section, you can also dive into Month's Supply of Inventory, which allows you to view inventory trends throughout the years and make any needed comparisons. Each chart is interactive, too! When you click on a tab, the chart updates with the underlying data.
Now that you understand the new datasets available to you, it's time to deliver this important information to your sphere. Check out this collection of market trends templates that will help you showcase the data you're sharing. Browse through and choose your favorites. They're all professionally designed, and you can grab them for free.
 |
 |
 |
 |
 |
 |
 |
 |
 |
 |
Once you have selected a design, simply search the neighborhood you are reporting on. Now write down the current metrics you'll be covering. For example, let's share the Market Trends for Scottsdale AZ 85255.
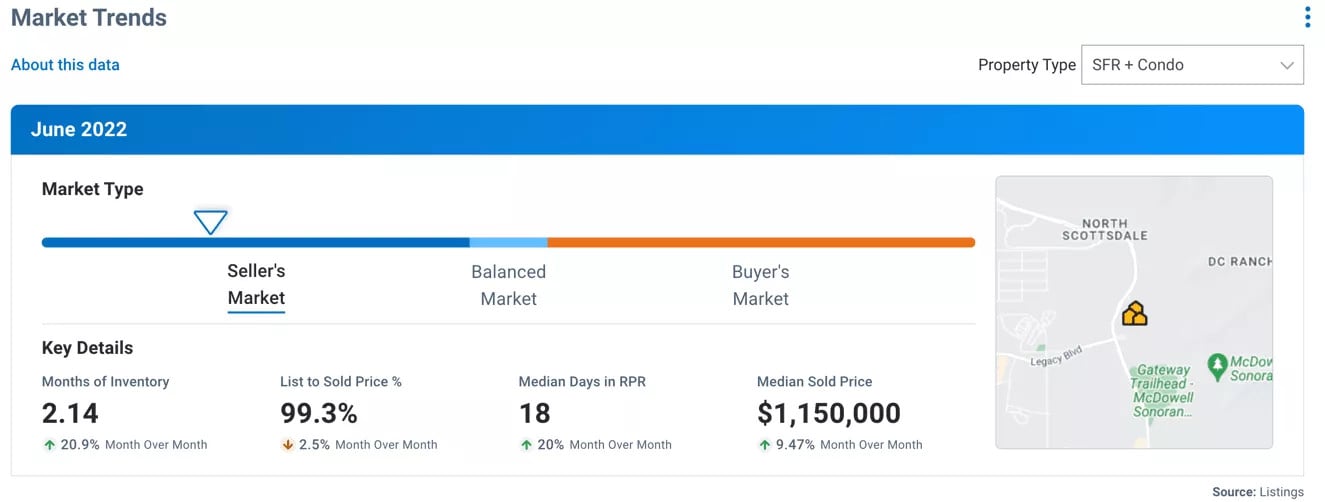
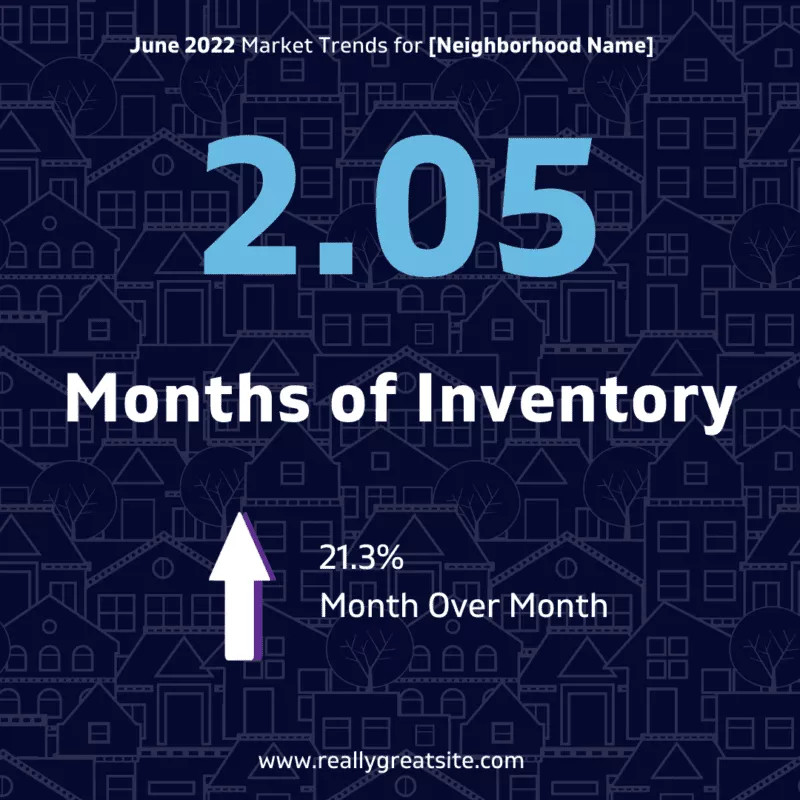
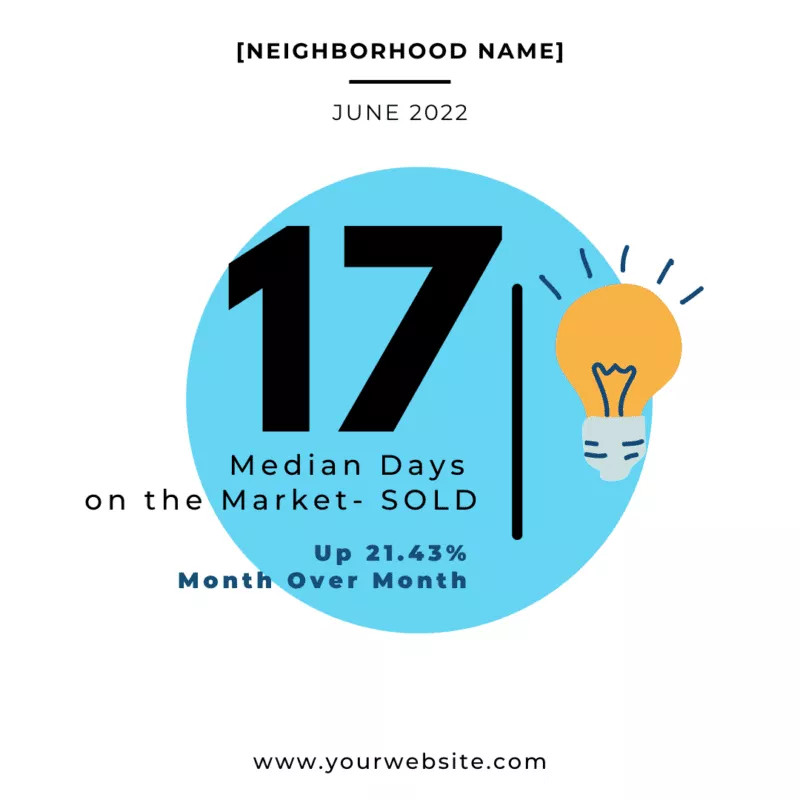
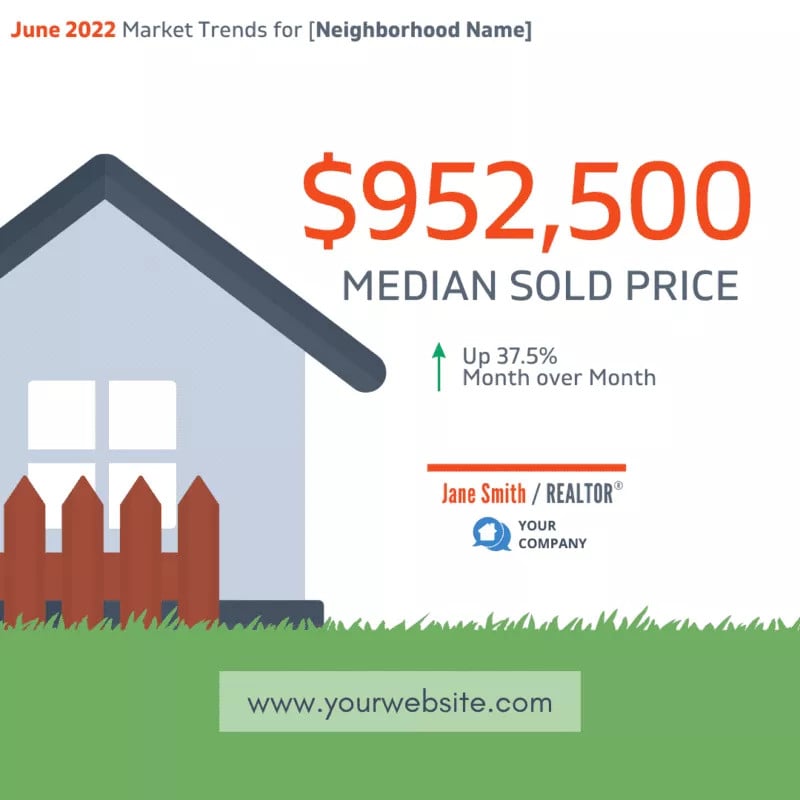
We can see the zip code 85255 has 2.14 Months of Inventory, which is up 20.9% month over month. Homes are selling slightly below list price at 99.3%, which is a decline of 2.5% since the previous month. And homes are taking around 18 days to sell, which is an increase of about 20% in the last month. And the Median Price of sold homes is hovering around $1,150,000.
With these numbers in hand, now click on the Canva template you'll be editing and begin to enter your numbers. Also, take a moment to click on any colors and update the layout to match your brand. Once you've finished updating your template, click "Share" in the top right corner of Canva. Now choose "Download" and select your file type. For social media, PNG will work great. But remember you can explore different formats based on your goals.
The Wrap Up
Delivering market updates through social media is a great way to let homeowners and potential home buyers in your market know that you are a local real estate expert.
Right now, consumers have lots of questions about the market and their home values. Posting these social media market trends helps to position you as the go-to source for up-to-date information.
To view the original article, visit the RPR blog.