
RETECHNOLOGY PREMIUM MARKETPLACE RELATED PRODUCTS | WEBINARS | SPECIAL OFFERS


You are viewing our site as an Agent, Switch Your View:
Agent | Broker Reset Filters to Default Back to ListFuture Proof Your Business by Knowing Your Market and Your Numbers
July 06 2022
 Markets move, and if you read the tea leaves, changes are coming.
Rising interest rates, among other things, are cooling home sales in many areas and experts believe that housing inventory will rise from its historically low levels.
As a Realtor, you need to be informed of any market changes so you can deliver local market expertise that highlights the opportunities of today's real estate market. One way to do that is to keep a constant tab on your market, and the corresponding statistics and data. And RPR (Realtors Property Resource) provides that knowledge in big, heaping spoonfuls.
Read on to see how RPR can help you stay up to date and in the know.
Markets, trends, charts and graphs
In true RPR fashion, we're constantly striving to improve your user experience. Your input, feedback and suggestions fuel our designers and developers. And it's why we keep making access to property data, and how to understand and share that data, better and better.
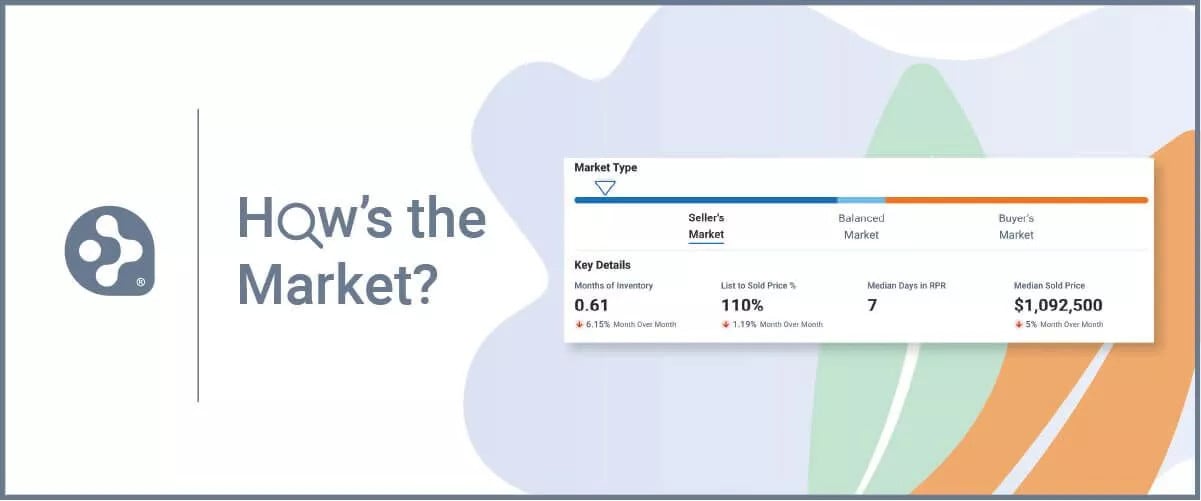
And now we make it easier than ever to answer the question, "How's the market doing?"
Case in point: the new "Summary" and "Housing" sections of the Neighborhood details pages, and the new "Market Trends" tab on any Property Details page. To see these new charts, check out our recent blog post: RPR Unveils New Charts and Graphs in its Neighborhood Pages.
All of these new layouts present local market activity, sales stats and inventory details, and package them in a new, easy-on-the-eyes layout and presentation.
Pro Tip: Locating the New Charts
- All of the new charts are on the Neighborhood pages (Summary and Housing tabs)
- On any Property Details Summary page, there is a new "Market Trends" tab that replaced the old "Charts" tab
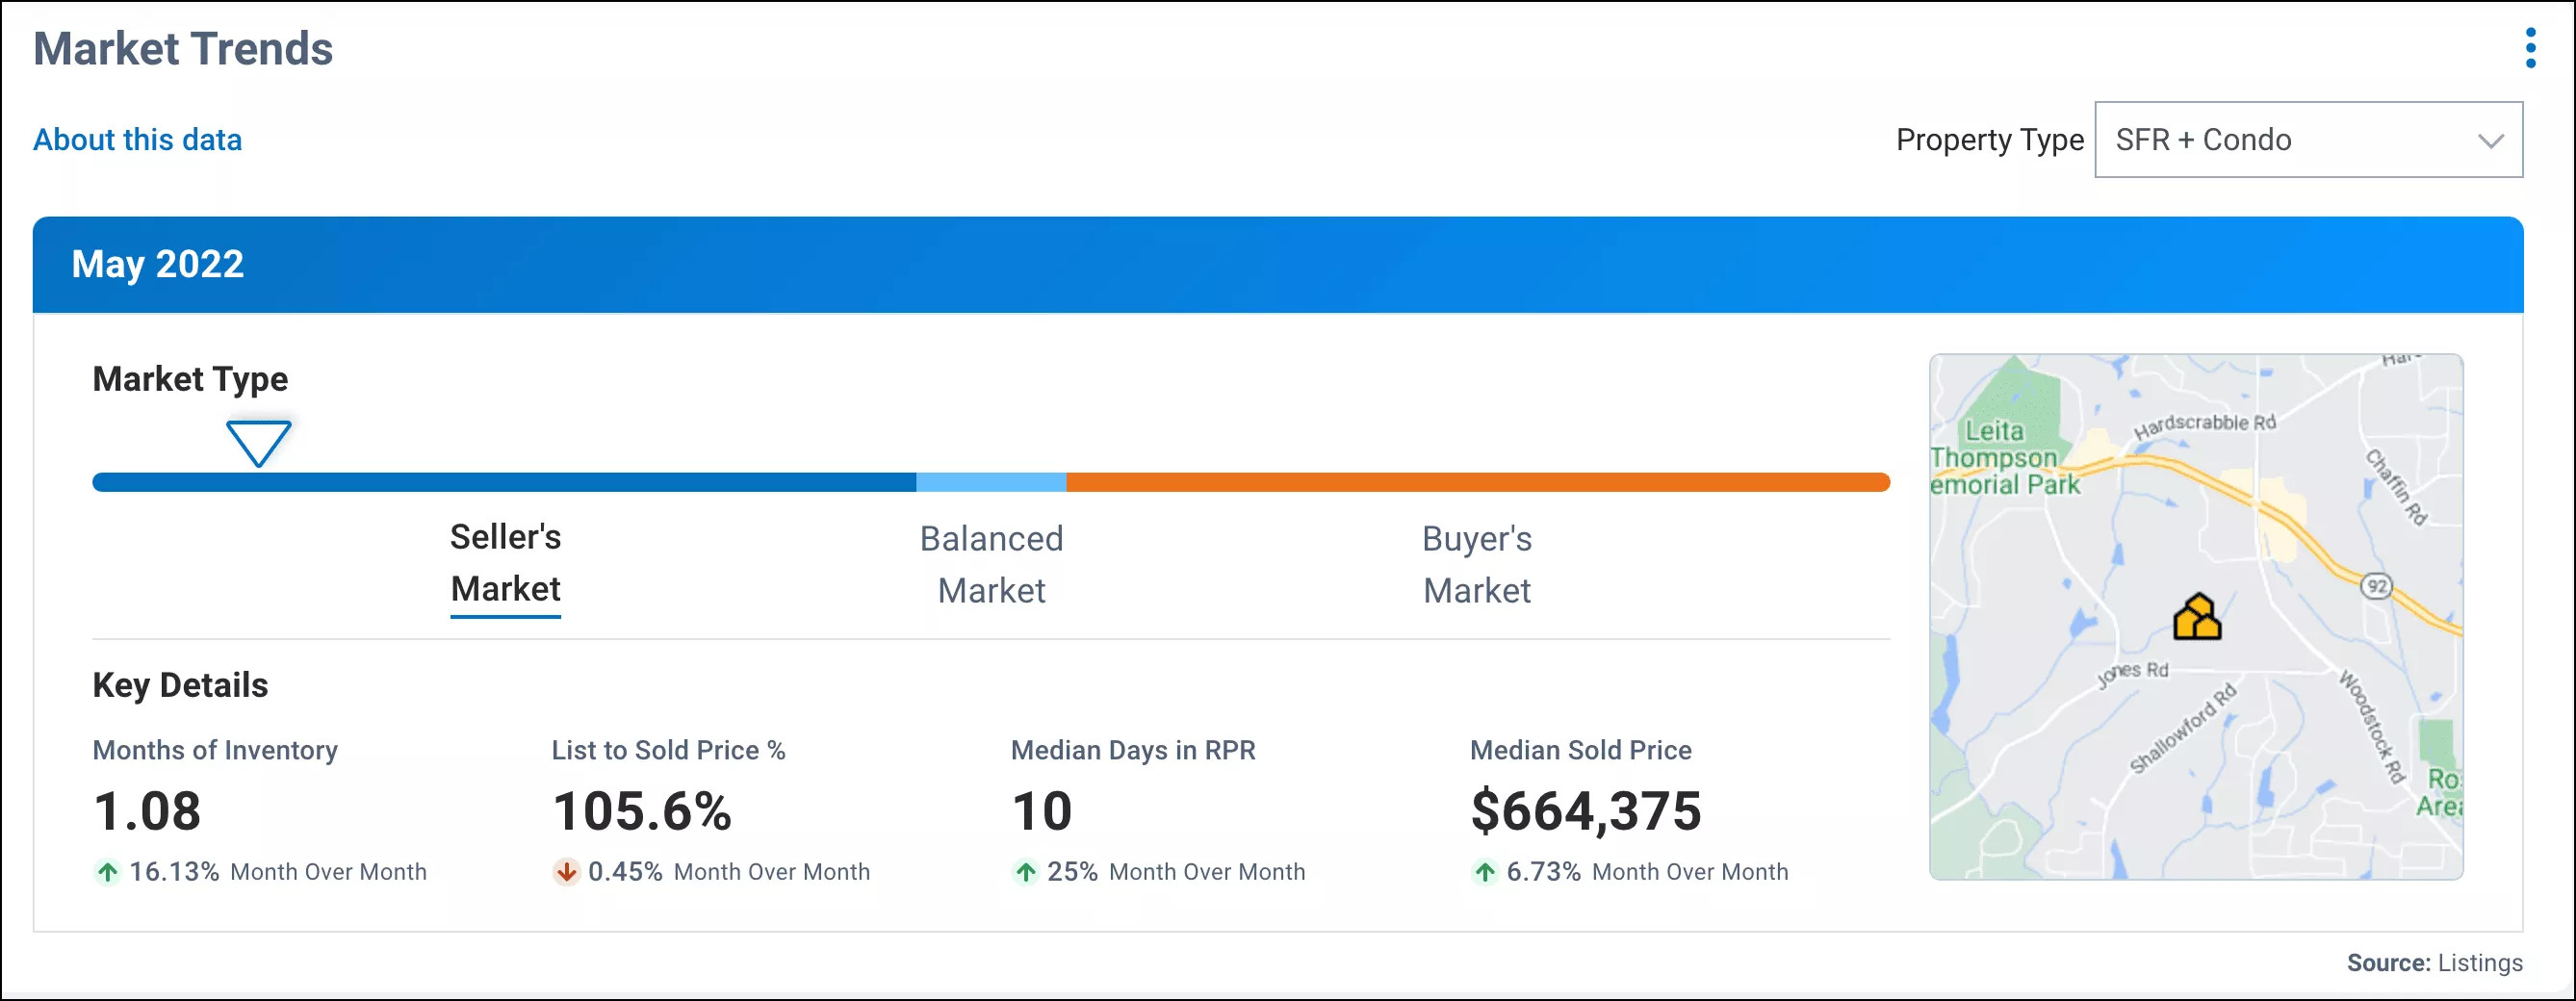
These updated charts are a snapshot of local market stats, including months of inventory, list to sold price, median days in RPR, and much more. You'll find this collection data, graphs and statistics incredibly helpful in explaining local market trends to your buyers and sellers. It's also an easy to understand topline that you can share with clients and prospects, which positions you as THE local market expert.
For example, in the Neighborhood "Summary" section, you can save or print out the "Market Trends" charts. (To include these new charts in an RPR Report, click the "Print" button, and then under the "Destination" pull down menu, you can choose to save the file as a .pdf. Save the file (chart) and then you can attach it to other RPR reports from the Reports generation page.)
This "Market Trends" chart is something home sellers and buyers will really appreciate. You can save the page to add to reports, or simply send it an email or text, or even post it as a graphic to your social media channels.
Sharing this information to potential and past clients is a solid strategy to position yourself as a market expert. Send it over and then connect with prospects or clients to walk them through the key details of Months of Inventory, List to Sold Price %, Median days in RPR and Median Sold Price. It can help sellers see how the market is shifting, and help buyers prepare competitive offers.
The RPR Market Activity Report
When one chart won't do, you can also send complete, comprehensive reports that are packed with housing data for a particular area.
The Market Activity Report showcases what is happening in the local real estate market. You can include new listings, closed sales, price changes, expired listings, open houses, and more. Market Snapshots display data for estimated home values, sale price, and list price, in the form of stats and map layers.
A Market Activity Report can be generated for almost any area, including; neighborhoods, zip codes, cities, school attendance zones, and even custom areas you create and save on the map.
- Run it for 3 days, a week, a month, 3 months, or 6 months
- Choose which property statuses to display
- Select property types, then filter by property characteristics
For a detailed how-to, check out: How to Create a Market Activity Report for any Neighborhood.
"My Markets" in RPR
Another smart way to keep tabs on local markets is to set up the "My Markets" area from the RPR homepage. This section is located just under the RPR "Shortcuts" icons, and is clearly labeled "My Markets."
This customization feature offers you "at a glance" updates on specific neighborhoods. Just hit "ADD" or "EDIT" to get started. Now, every time you visit RPR, your chosen markets will be waiting for you. From there, you can easily track activity within the area.
And while it's pretty intuitive, here's a My Markets How-To if you need more detailed instructions.
Market awareness and preparedness
Wherever the housing market is headed, you need to be prepared. Be open with your clients about inventory levels, days on market, and whether homes are going for above asking price. Share your insight on emerging trends and how they can use this info to their advantage. After all, they count on you to be a trusted adviser when it comes to their (most likely) largest investment.
Knowing these important metrics and statistics can help you prepare for the ups and downs that are sure to come. And keeping tabs on local markets with up to date charts, stats, data and graphs from RPR is one of the best ways for you to do it.
To view the original article, visit the RPR blog.