
RETECHNOLOGY PREMIUM MARKETPLACE RELATED PRODUCTS | WEBINARS | SPECIAL OFFERS


You are viewing our site as a Broker, Switch Your View:
Agent | Broker Reset Filters to Default Back to ListRPR Commercial: Exploring Data Layers
February 24 2022
 RPR (Realtors Property Resource) offers commercial practitioners access to 826K+ active listings and 56 million off-market properties, all in one place, for no extra charge whatsoever. You can also utilize various types of data-driven reports and tools to help you advise and serve your commercial clients.
In this article, we're going to focus on how to effectively use the RPR Commercial Maps, specifically how to apply data layers when conducting research. Map Data Layers are an overlay that add trends, indicators and flood zones to the map.
Commercial Map Data Layers: reveal, then peel
You can start a map search by clicking the Research menu (in the upper right navigation area) and then select Commercial Map Insights.
Within the map, RPR provides data layers intended to provide a visualization of important attributes in order to help identify the best area for a business or property. Commercial pros can enable these layers on the map to help further their search parameters.
Note: when you use the Commercial Map Insights to navigate, the Data Layers will automatically be displayed. If you click on the map or start a search from the main homepage search bar, just hit the Data Layers icon in the lower right section of any map to bring them up.
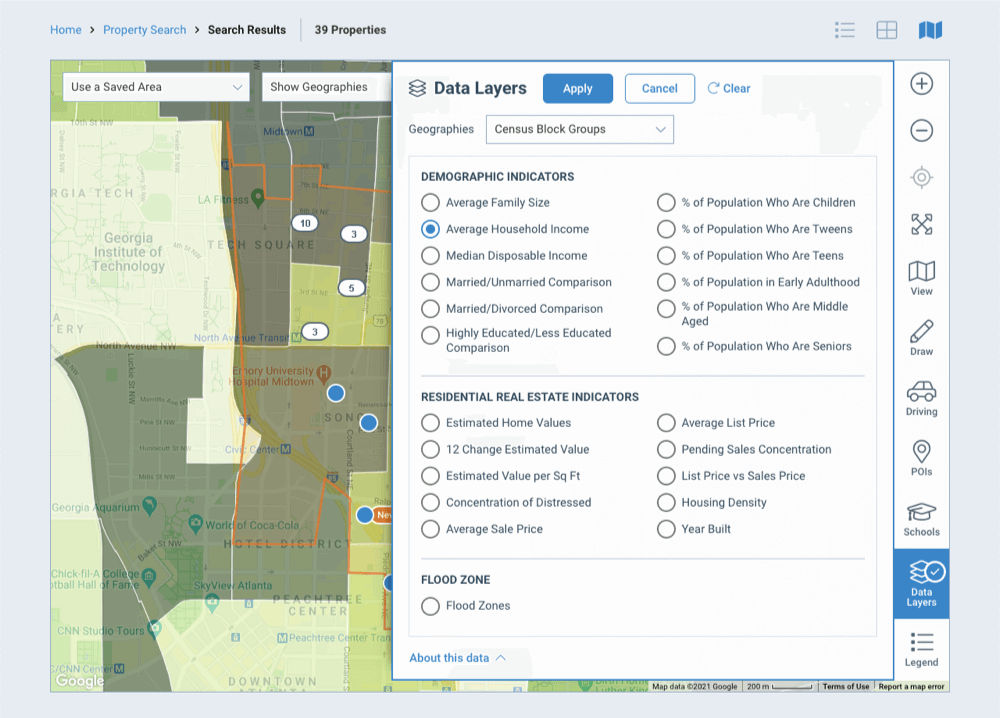
The Data Layers showcase Demographic Indicators such as:
- Average Family Size
- Average Household Income
- Median Disposable Income
- Married/Unmarried Comparison
- Married/Divorced Comparison
- Highly Educated/Less Educated Comparison
- % of Population Who Are Children
- % of Population Who Are Tweens
- % of Population Who Are Teens
- % of Population in Early Adulthood
- % of Population Who Are Middle Aged
- % of Population Who Are Seniors
You can use this type of information to help advise a commercial client on ideal locations to open a business, or perhaps to advise an investor client on multi-unit housing needs in an area. Within the same area, you can also reveal Residential Indicators such as:
- Estimated Home Values
- 12-Month Change Estimated Value
- Estimated Value per Sq Ft
- Concentration of Distressed
- Average Sale Price
- Average List Price
- Pending Sales Concentration
- List Price vs Sales Price
- Housing Density
- Year Built
Flood Zones
This layer will show color-coded flood zone areas as identified by FEMA. Simply click the More tab for a full explanation of flood risks and how they are determined.
Once you have selected your data set, you can change the geography boundary and click Apply to see your selected data visualized across the larger area. A legend for interpreting the data is shown on the bottom right of the map, as well as an explanation of how the data was collected.
Pro Tip: It's helpful to choose the "Road" map view option when using the map layers so you can better visualize the data.
Data layer map wrap
Peel back layer after layer of data and then advise your clients accordingly. RPR's powerful map functions provide important insights and provide a strong tool for visual analysis. This can arm you with community intelligence that will help you promote a property by understanding the competition around a potential new restaurant, or do a quick check to see if a building is in a flood zone.
To view the original article, visit the RPR blog.