
RETECHNOLOGY PREMIUM MARKETPLACE RELATED PRODUCTS | WEBINARS | SPECIAL OFFERS


You are viewing our site as a Broker, Switch Your View:
Agent | Broker Reset Filters to Default Back to ListRPR Commercial: Map out a Path to Success
August 04 2020
 As a commercial real estate practitioner, your clients count on you for sound advice and expert guidance. One easy way to help them make more informed decisions is by mastering the RPR map.
RPR's powerful map functions provide layer after layer of important insights. These maps provide a visual analysis, arming you with community intelligence that will help you promote a property with high traffic counts, understand the competition around a potential new restaurant, or do a quick check to see if a building is in a Flood Zone or Opportunity Zone.
The following "how-to" article will help you understand how to use RPR maps to research what is going on around a property to provide a game plan for your marketing efforts or advise a client on their next investment.
Use RPR Maps to Discover Insights
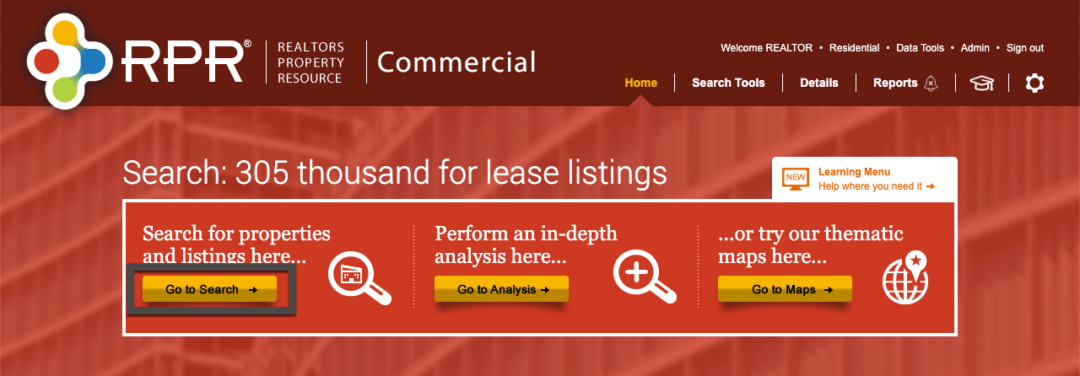
Maps are sprinkled throughout the commercial side of RPR, and there are a few ways to access them. A good place to start is from the search results page and from there, you can jump into the thematic map search from the home page. However, the most value can be found when looking at the map from a property detail page. Here's how to get there:
- Visit narrpr.com/commercial
- Start by selecting "Go to Search" from the homepage
- Type in a property address
- Now select the magnifying glass icon and you will be taken to the property detail page
- On the property detail page, in the top right, you will see a small map with a button to enlarge it
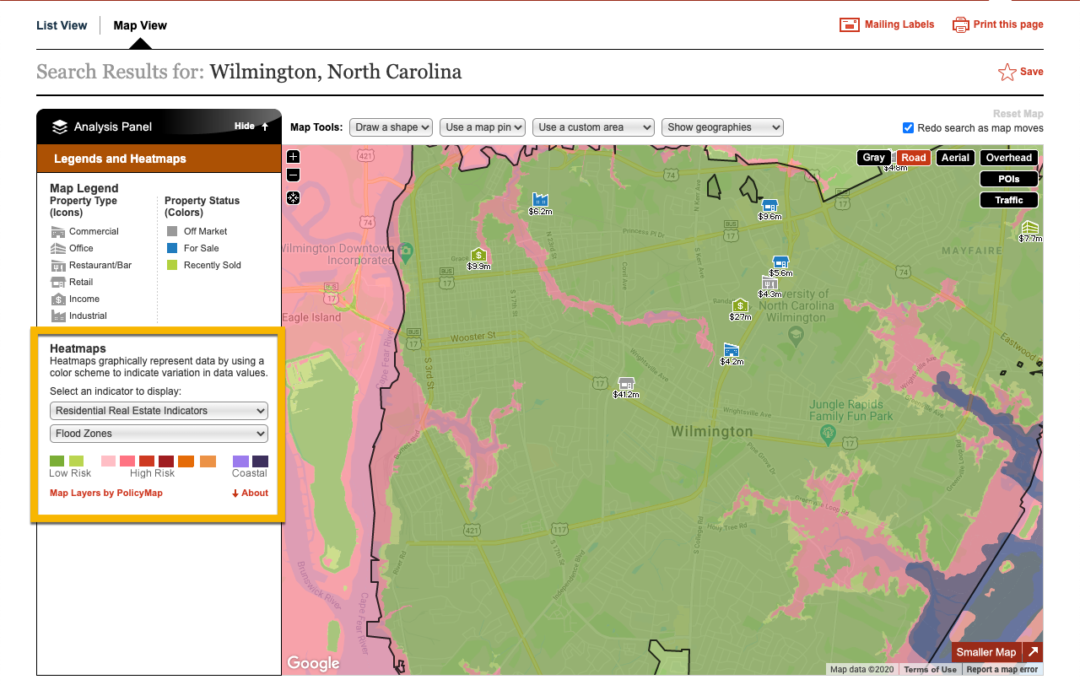
Heat Maps
1. On the left of the map, select the map layers to visualize. Choose one of three indicators:
- Demographic
- Spending
- Residential Real Estate
2. Then pick which dataset to display
The data indicators are shaded at a variety of geographic levels. Pan and zoom the map to find high or low concentrations of the indicator of interest, and click directly onto the map to see the data represented, with options to search for listings in that area, start an analysis, view the Trade Area details or Create a Report.
Not sure what to try first? Checkout the Flood Zone overlay by selecting "Residential Real Estate" from the Heat Maps dropdown. Then choose "Flood Zones." Want to dive deeper into Flood Zones? Check out this support article on RPR Flood Zones.
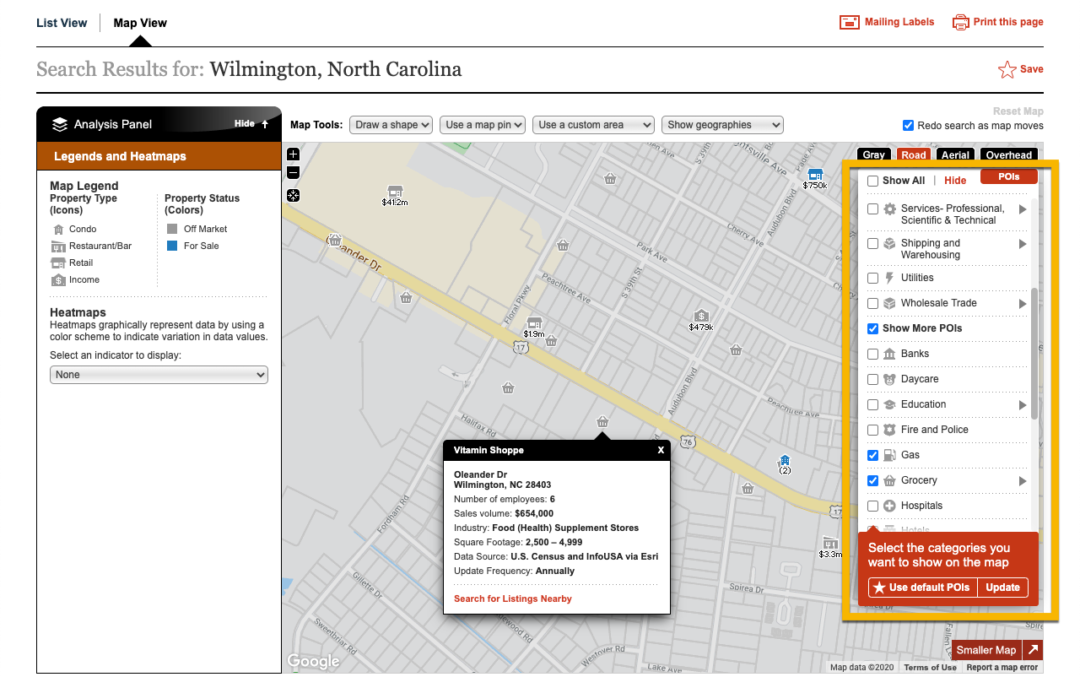
Points of Interest (POIs)
To view businesses in the area, click the POIs icon on the upper right side of the map. Select "edit" to choose the specific business type to display. The POI feature provides access to more than 20 million business points including shopping, manufacturing, finance, restaurants and bars, and more.
- Tip: Scroll to the bottom of the map layer and click "Show More POIs" to access more business types such as hotels, daycares or hospitals.
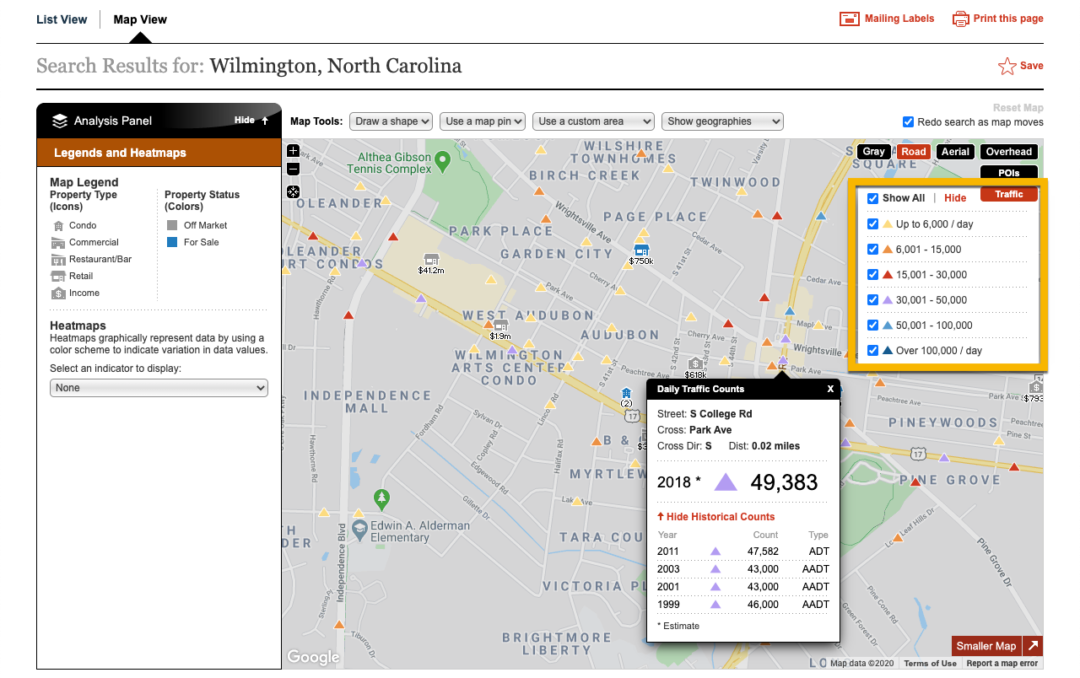
Traffic Counts
Also from the RPR map, access traffic counts and select which level or all levels of traffic counts you want visible. Once applied, the map will populate counts using a triangle indicator with varying colors reflecting the AAPD (average annual per day), which is a seasonally adjusted count representing the average day of the year.
These indicators look at the latest historical count data from studies done by the local department of transportation, but also include projections by our data provider Kalibrate. (If the counts are out of date, they have likely changed due to population growth or roadway changes.)
Geography Layers
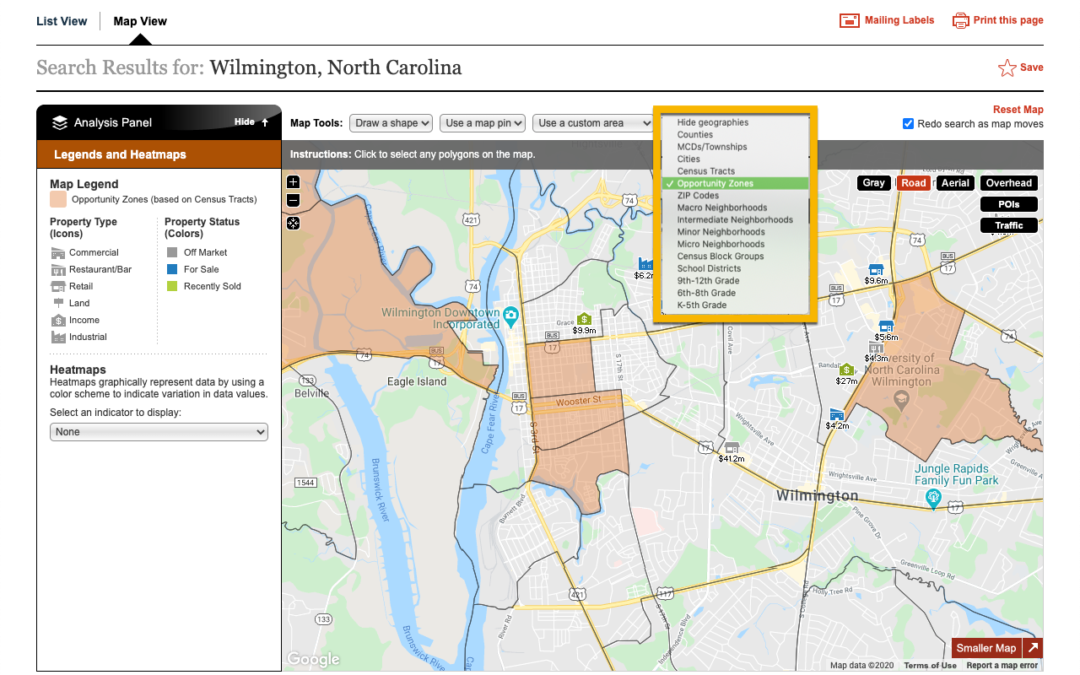
The last visualization layer we want to highlight is found within the Geography Layer drop down. To access it, go to the top of the map and look to the furthest drop down to the right, here you'll see "Show Geographies." From this list you can use the map boundaries, such as census block groups and neighborhoods, but you also have the option to see Opportunity Zones.
Whether you are putting marketing material together for a listing, researching space for an investor, or farming for clients, being able to quickly identify if a property is in an Opportunity Zone can have a major impact on how you approach the opportunity.
The Map Wrap
We hope you have a better understanding of RPR maps as they pertain to commercial real estate. Once you're more familiar with them, try using them for a property search, or to create Trade Area Reports within RPR. Here's another solid tip: users can take screenshots of all the map visualizations and add them to the property detail page and include them in a property report.
To view a tutorial in action, be sure to check out this quick video, RPR Maps: Commercial. Happy mapping!
To view the original article, visit the RPR blog.