
RETECHNOLOGY PREMIUM MARKETPLACE RELATED PRODUCTS | WEBINARS | SPECIAL OFFERS


You are viewing our site as a Broker, Switch Your View:
Agent | Broker Reset Filters to Default Back to ListHow to Deal with Coronavirus in My Business: An Analytical Approach to Business Leading Indicators, Part 3
April 13 2020
 I recently talked about trending data as we are seeing it now. You can find that article by clicking here, and you may want to read it before reading this article.
Additionally, I did a follow-up article to the first one where I discussed Rate of Change analysis methodology that I use from ITR Economics. That article can be found here and I also recommend reviewing that article first before you read this one.
For this article, I want to discuss analyzing the lead flow into your business from your website. I will caution that you need to consider multiple factors when tracking and analyzing your lead flow. I'll mention some of these below.
As I mentioned in my last article, I pay attention to multiple data points utilizing the 12/12 trending and the 3/12 trending. One of the data points I have closely watched for many years, 19 to be exact, is the total leads being generated on websites. Ten years ago, I added to my trending the Rate of Change trending to help better analyze and predict trends.
With that said, I want to dig into some numbers that you should be paying attention to.
What Was Going on with Real Estate Website Leads Before Covid-19 Hit?
Prior to Covid-19, I was projecting that 2020 was going to be an amazing year for the residential real estate industry. All my leading indicators were pointing towards not only strong demand, but increasingly strong demand and interest in homes for sale.
The graph below is the same graph I shared in my last article, but I want to share it again and point out the strong growth trend that I was seeing in website traffic leading into 2020. Not only was web traffic growing (the green line is positive) year over year, but it was aggressively growing faster and faster since May 2019.
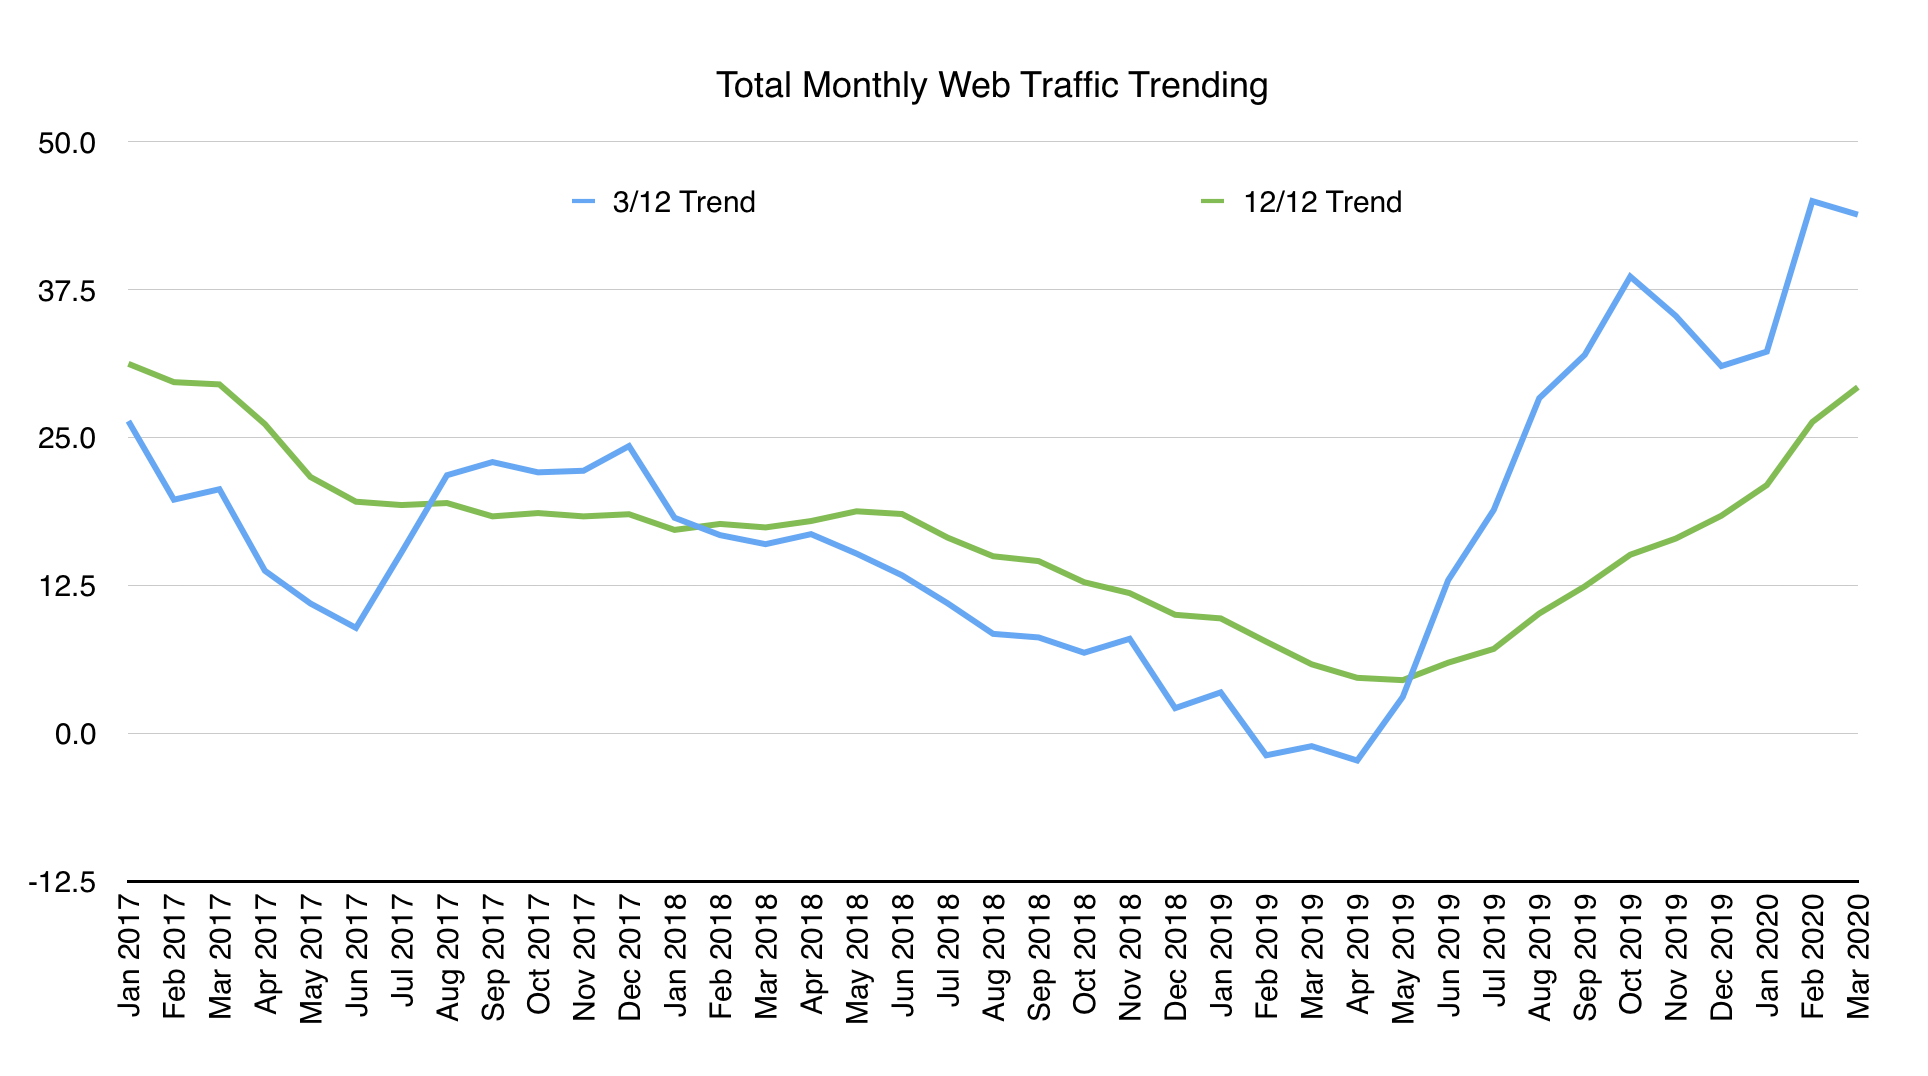
I point that graph out again because one of the constraints this company was facing in late 2018 and into 2019 was inventory constraint. Because of the inventory constraint and the fact that properly priced properties were selling almost immediately, consumer behavior was changing in this market. In this market, we were seeing a continued trend through the past 18 months of fewer web-generated showing and email requests. This downward trend had become even more pronounced late in 2019.
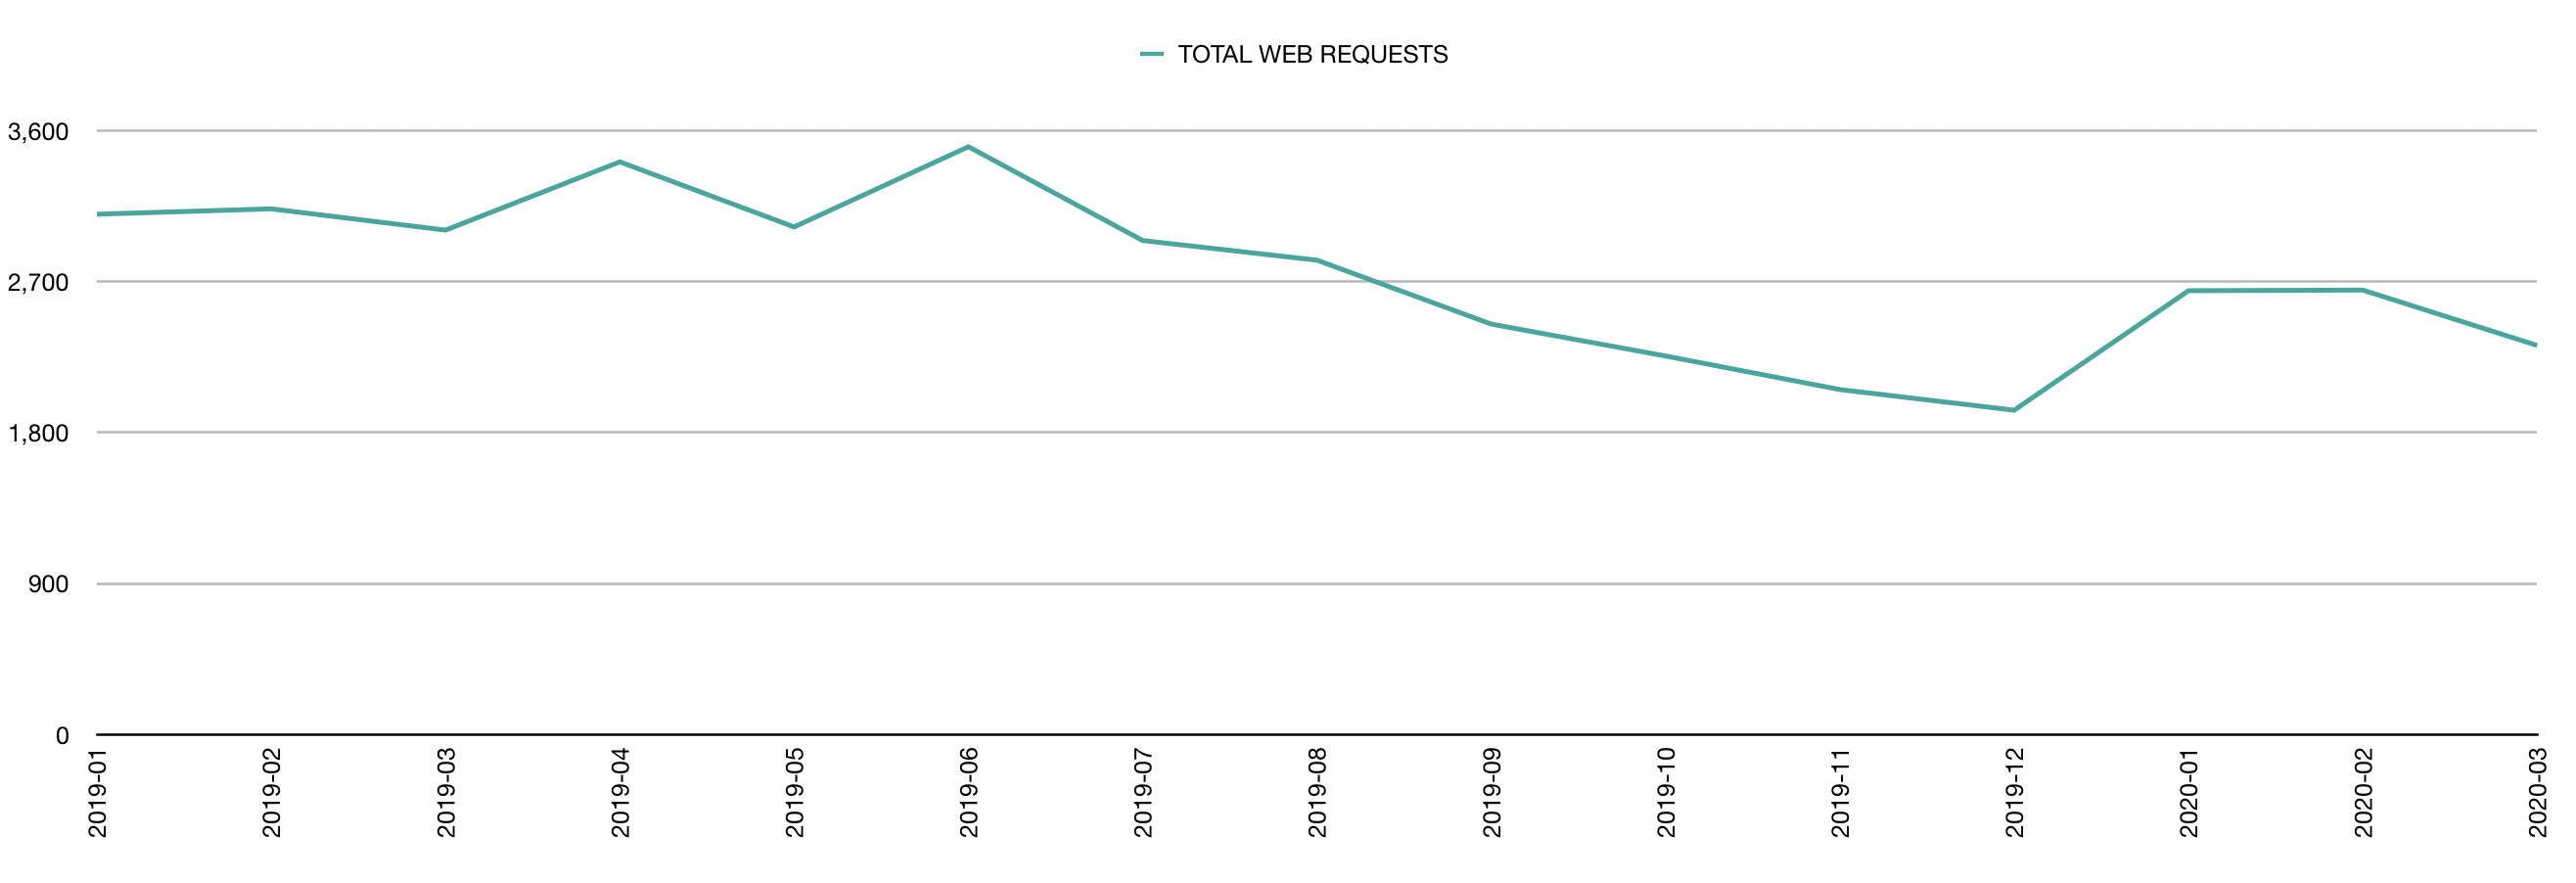
However, in January 2020, we started to see that trend reverse with increasing showing requests and email requests. That trend, however, has ceased due to Covid-19. The graph below shows the decrease in web leads from June 2019 through December 2019, but also starting to climb back up in January 2020 at a faster pace than the seasonal increase expected. This, coupled with the increase in web traffic and the direct client feedback pointed towards a strong 2020.
What Is Going on with Real Estate Website Leads Due to Covid-19?
As a result of Covid-19, we saw decreasing lead counts all March. The graph below shows a rolling-7 graph of the total number of leads expected (green line) and actual (blue line). By this time in the month, we expected to have over 800 leads per week from the website, representing about 3,200 leads per month. Instead, we saw 399 leads during those seven days.
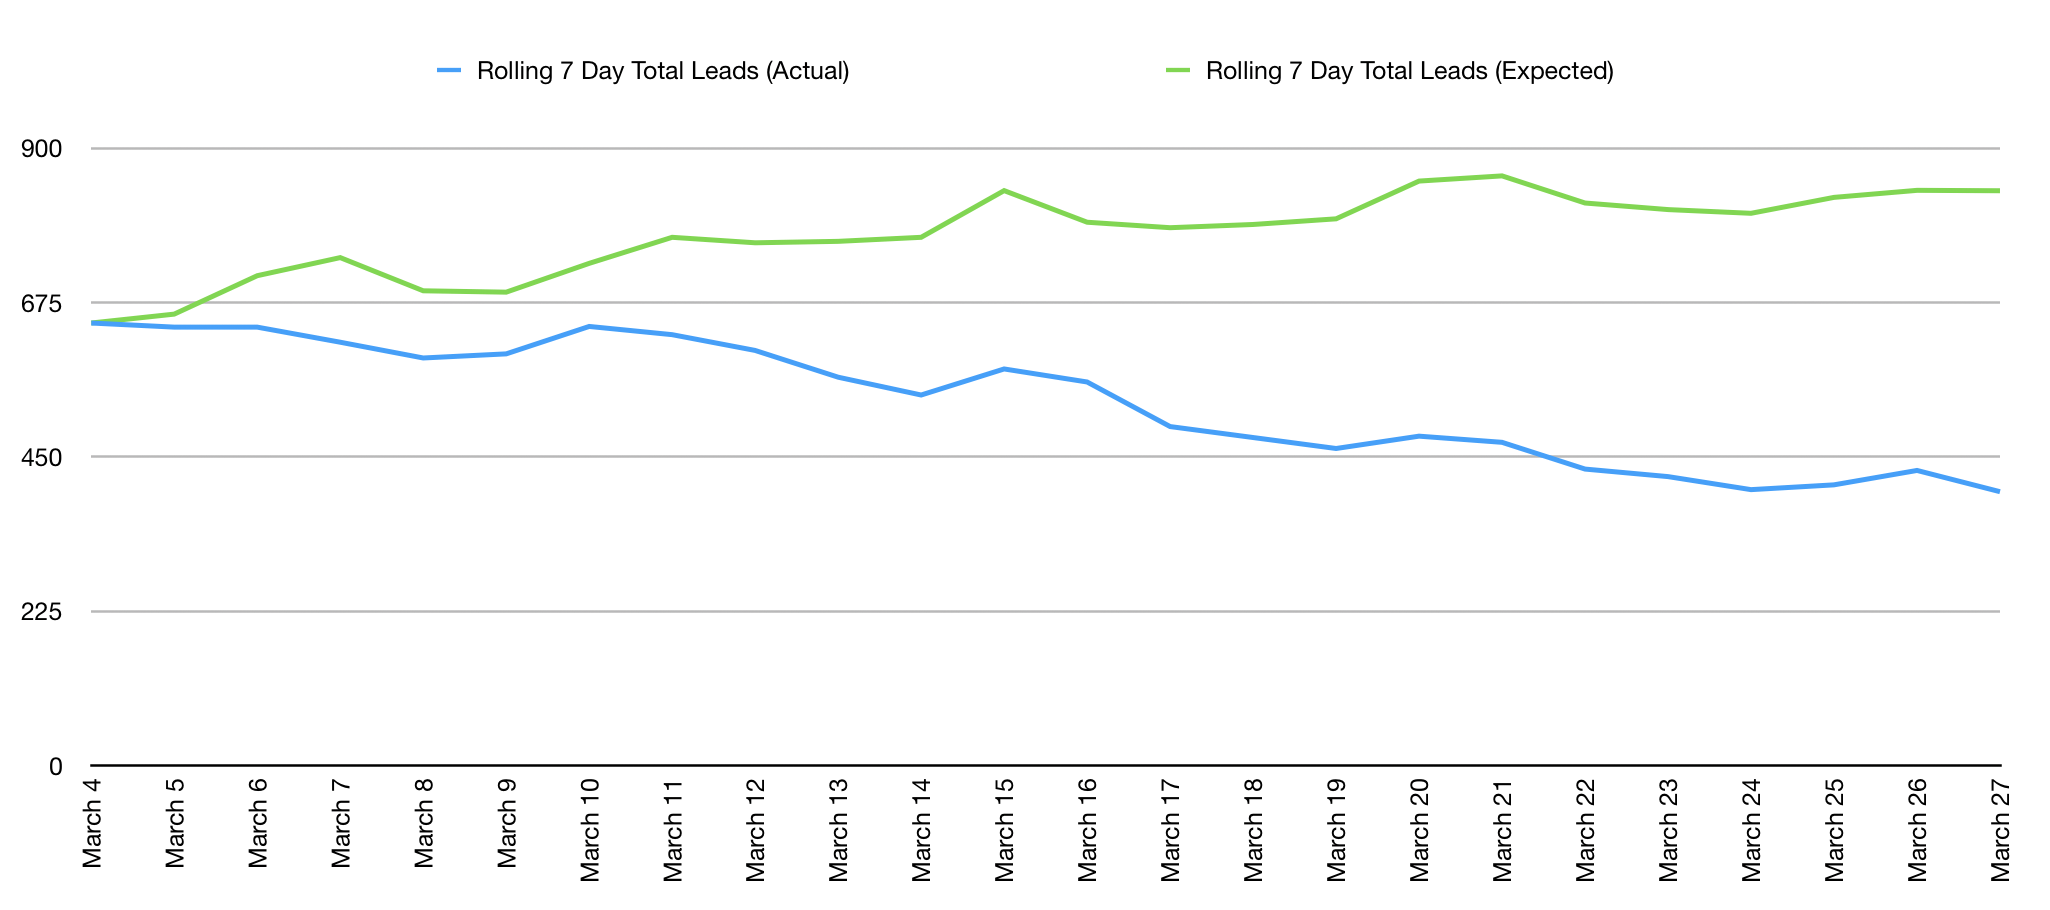
This drastic trend is mostly caused by a significant drop in the number of showing requests coming in. This is not unexpected. However, it should be pointed out that there have only been 17 showing requests the past seven days and, this time of year, there should be significantly more.
What we want to watch is what these numbers do over the coming days. It will be important to track the lead volume over the next 7 to 14 days to see what trends start emerging especially as the country starts getting back to normal and the results of the stimulus bill (H.R. 748) start kicking in.
More to Come
I still have more articles planned. I will do a follow-up article next week sharing what I am seeing and I plan on doing so at least once weekly as we work through the impact of Covid-19.
To view the original article, visit the Delta Media Group blog.