
RETECHNOLOGY PREMIUM MARKETPLACE RELATED PRODUCTS | WEBINARS | SPECIAL OFFERS


You are viewing our site as a Broker, Switch Your View:
Agent | Broker Reset Filters to Default Back to ListHow to Deal with Coronavirus in My Business: An Analytical Approach to Business Leading Indicators, Part 2
April 05 2020
 Last week, I talked about trending data as we are seeing it now. You can find that article by clicking here, and you may want to read it before reading this article.
For this article, I want to discuss a tool that I have found to be invaluable in my businesses, called Rate of Change. This tool, or methodology, comes from ITR Economics. I was introduced to ITR Economics ten years ago through my Vistage group. What stuck out to me about this methodology of analyzing current data and leading indicators is it provided early insight into trending changes that affected my business.
Specifically, for Delta Media Group, using this methodology, I found early indicators that gave me an 11-month indication of coming changes, good or bad, happening in the business. Imagine knowing 11 months ahead of time, or even just two or three months ahead of coming changes in your business. For me, it has been a game-changer, and I want to share with you what I see right now as it relates to the residential real estate industry.
Understanding Rate of Change
Rate of Change (more detailed information is available here) shows the rate at which a data set is changing on a year over year basis utilizing a rolling-12 rate (12/12) compared to a year-over-year three-month rate (3/12). Specifically, when using rate of change on an income analysis, you will know if your cash flow is trending up year over year, and if you can expect that trend to continue by comparing the 12/12 value to the 3/12 value.
If you don't use this type of analysis on your business, especially income, I would highly recommend you get familiar with it and the four business cycles and what you should be doing in each of those cycles.
Enough of this—let's talk about the actual trending that I am seeing.
What Were the Leading Indicators up Until March?
In the past 20 years, I have found that, when interpreted properly, website traffic trending data is very useful in forecasting residential real estate business trends. It becomes especially useful when combined with rate of change tracking on website generated lead numbers.
Until March 2020, I was tracking data indicating that 2020 was shaping up to be a fantastic year for residential real estate on a national level. On a regionalized basis, I could see different data trending that wasn't very surprising when I took into consideration some of the regionalized things going on. Markets that had slowed growth in 2019 and had massive price appreciation were showing slowing growth in 2020 while other markets, particularly markets where prices had not appreciated to extreme levels, were seeing much faster growth rates for 2020.
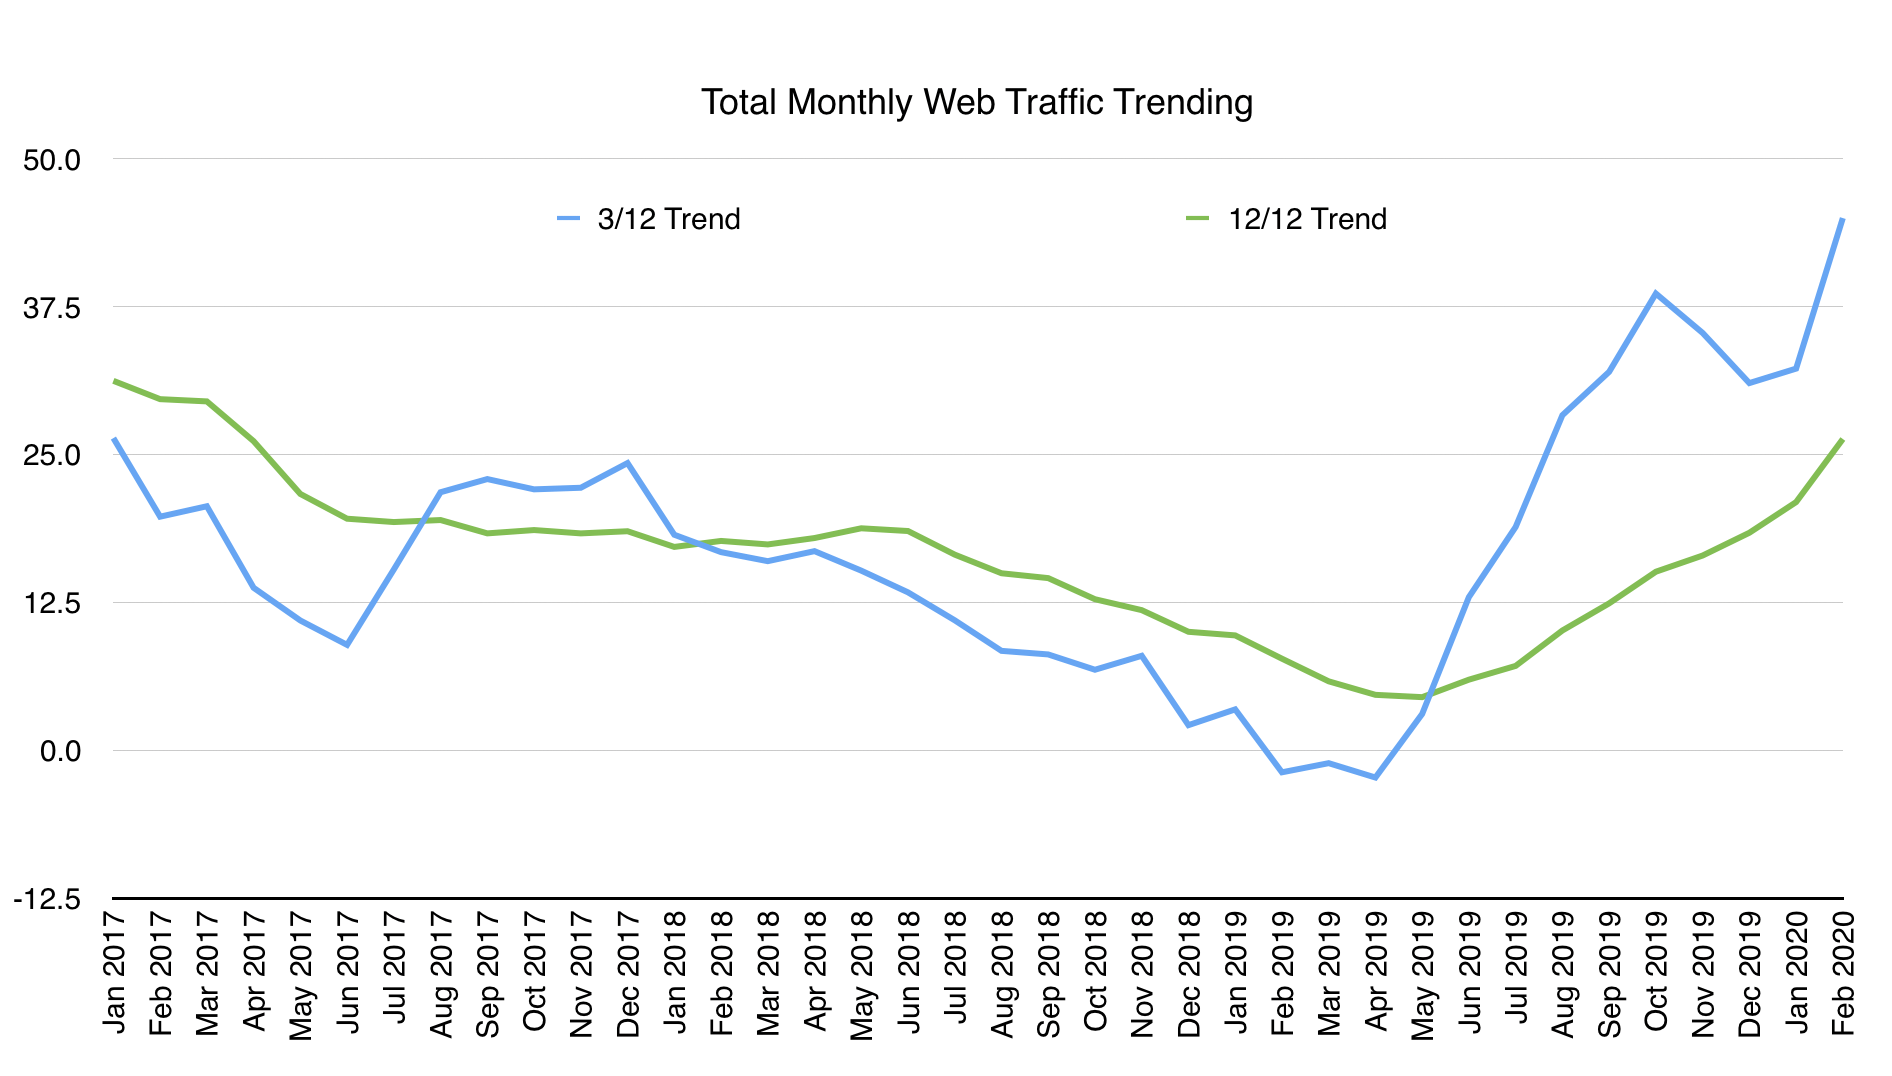
The graph below shows website traffic rate of change trending between January 2017 and February 2020 for one large website I closely track located in the eastern United States. The green line (12/12) on the graph below shows that website traffic has been growing year-over-year on this site the entire time. The value is above zero, and the higher the number, the higher the growth factor year over year. The blue line on the graph below (3/12) shows the rolling three-month year-over-year average.
When the blue line is above the green line, I like to say that it is pulling the green line up, and this is good. When the blue line is below the green line, it is pulling it down, and that could be bad. In this case, website traffic was always growing, but the growth was slowing. You can see that since May 2019, website traffic was starting to pick up more and more. You can also see that the 3/12 trending, the blue line, was growing towards an extreme level up until February 2020. Had this trend simply continued, it would have meant that web traffic would have increased significantly (at least 30% YOY), and I can tell you that leads would have followed the same trend. Imagine a growth of 30% over 2019!
What are the Leading Indicators in March?
So, that was the good news I was seeing up until March.
What do I see now?
First, let me remind you that you need to pay attention to your own data. Your data is the data that matters. You have your own market-specific data points to contend with, such as price appreciation pressure, cost of living, available inventory, etc. These items are specific to your own business and will impact you differently, depending on where you are in the nation.
Second, let me state that I see different impacts on traffic that the early data indicates a correlation to localized Coronavirus impact on localized web traffic impact. What I am seeing does indicate, as expected, that if you are in a Coronavirus "hot spot," you are impacted at a greater level than others.
With that said, let me share some numbers I am seeing.
The graph below shows a trending analysis that, while I don't condone, I still utilize carefully. This graph shows a weekly cycle trending, instead of monthly trending, using a year-over-year 52-week comparison to a three-week year-over-year trending analysis (52/52 and 3/52) of Organic Search Traffic to the same website. I highlight the Organic Search Traffic because Organic Search Traffic is more indicative of new client acquisition than the other traffic sources we track, and I believe it is more of an early indicator of what is happening now.
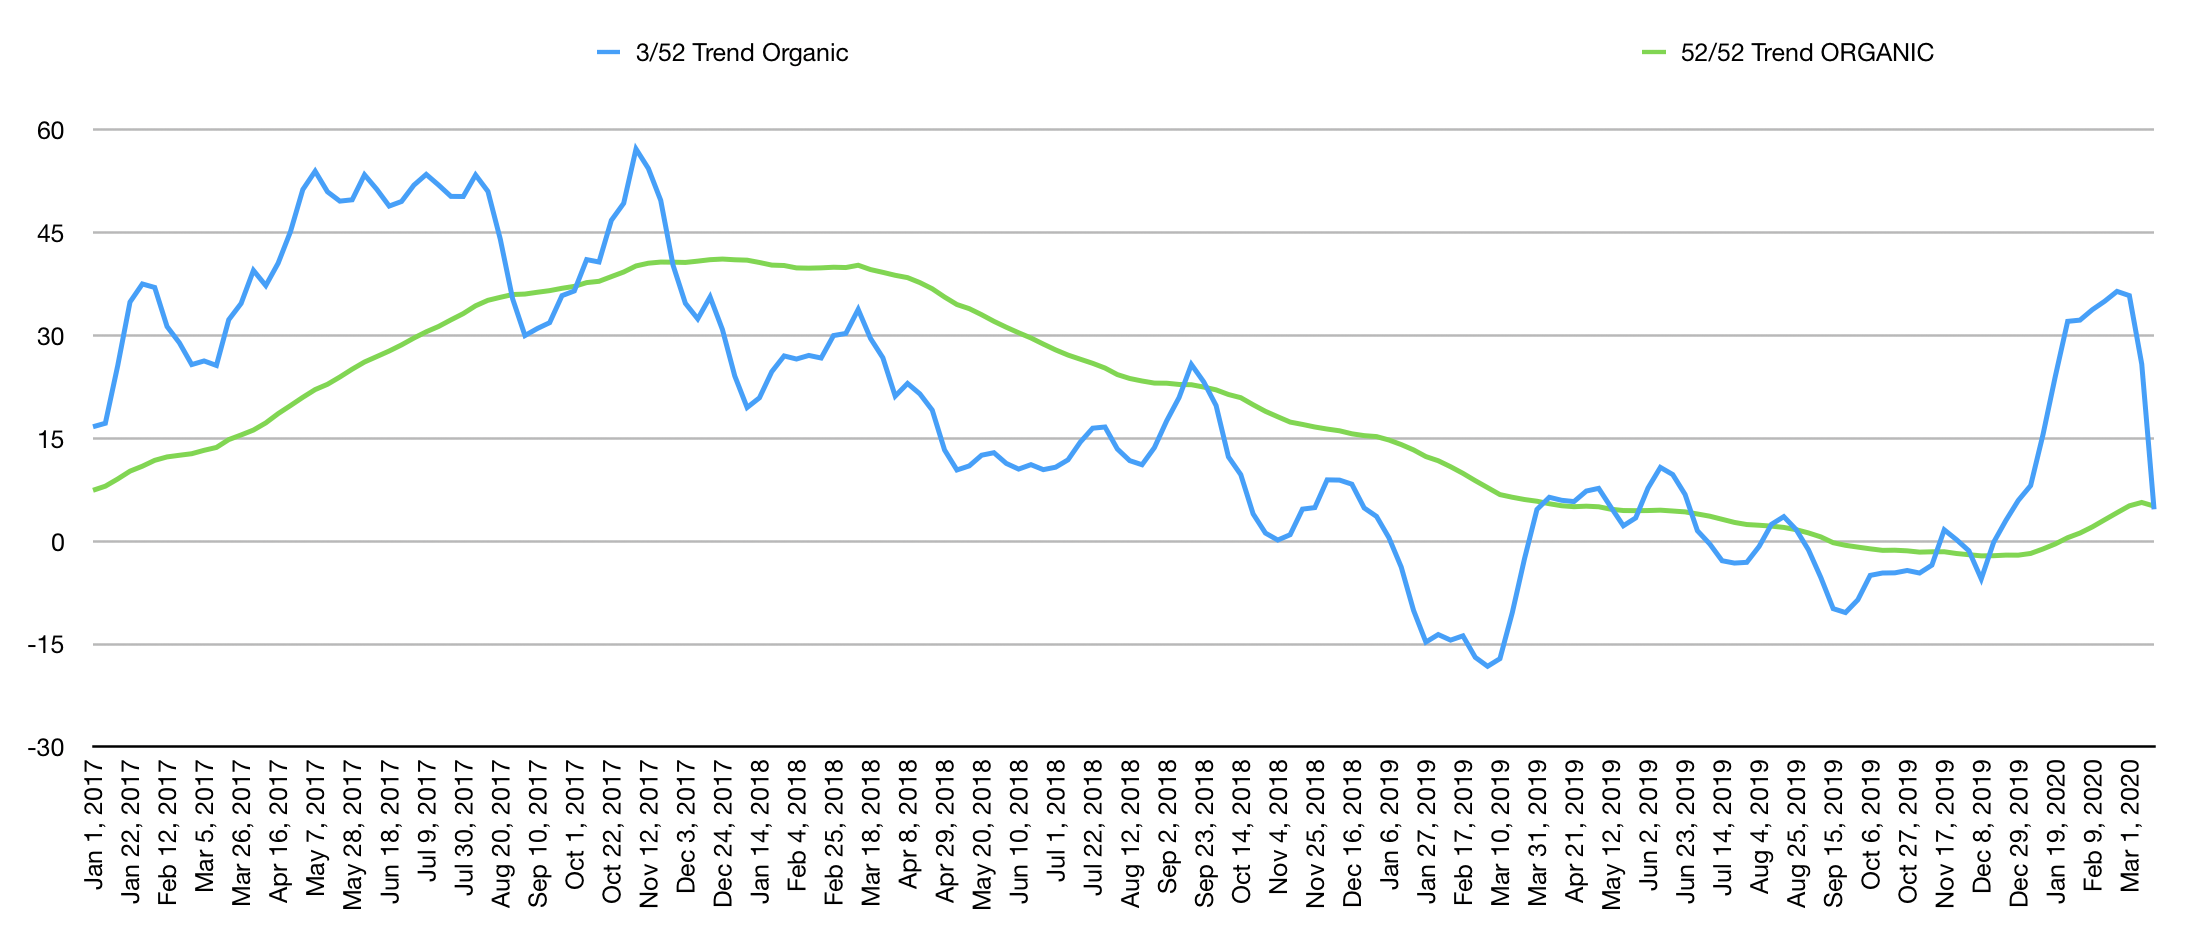
As you can see from the graph above, Organic Search Traffic is dropping off significantly, but it is still higher, looking at a three-week average, than the same time period in 2019.
However, on the graph below, if you look at Organic Search Traffic year-over-year for the same site directly from Google Analytics, you can see it has fallen below 2019 levels since March 12th. This should be paid attention to and watched closely.
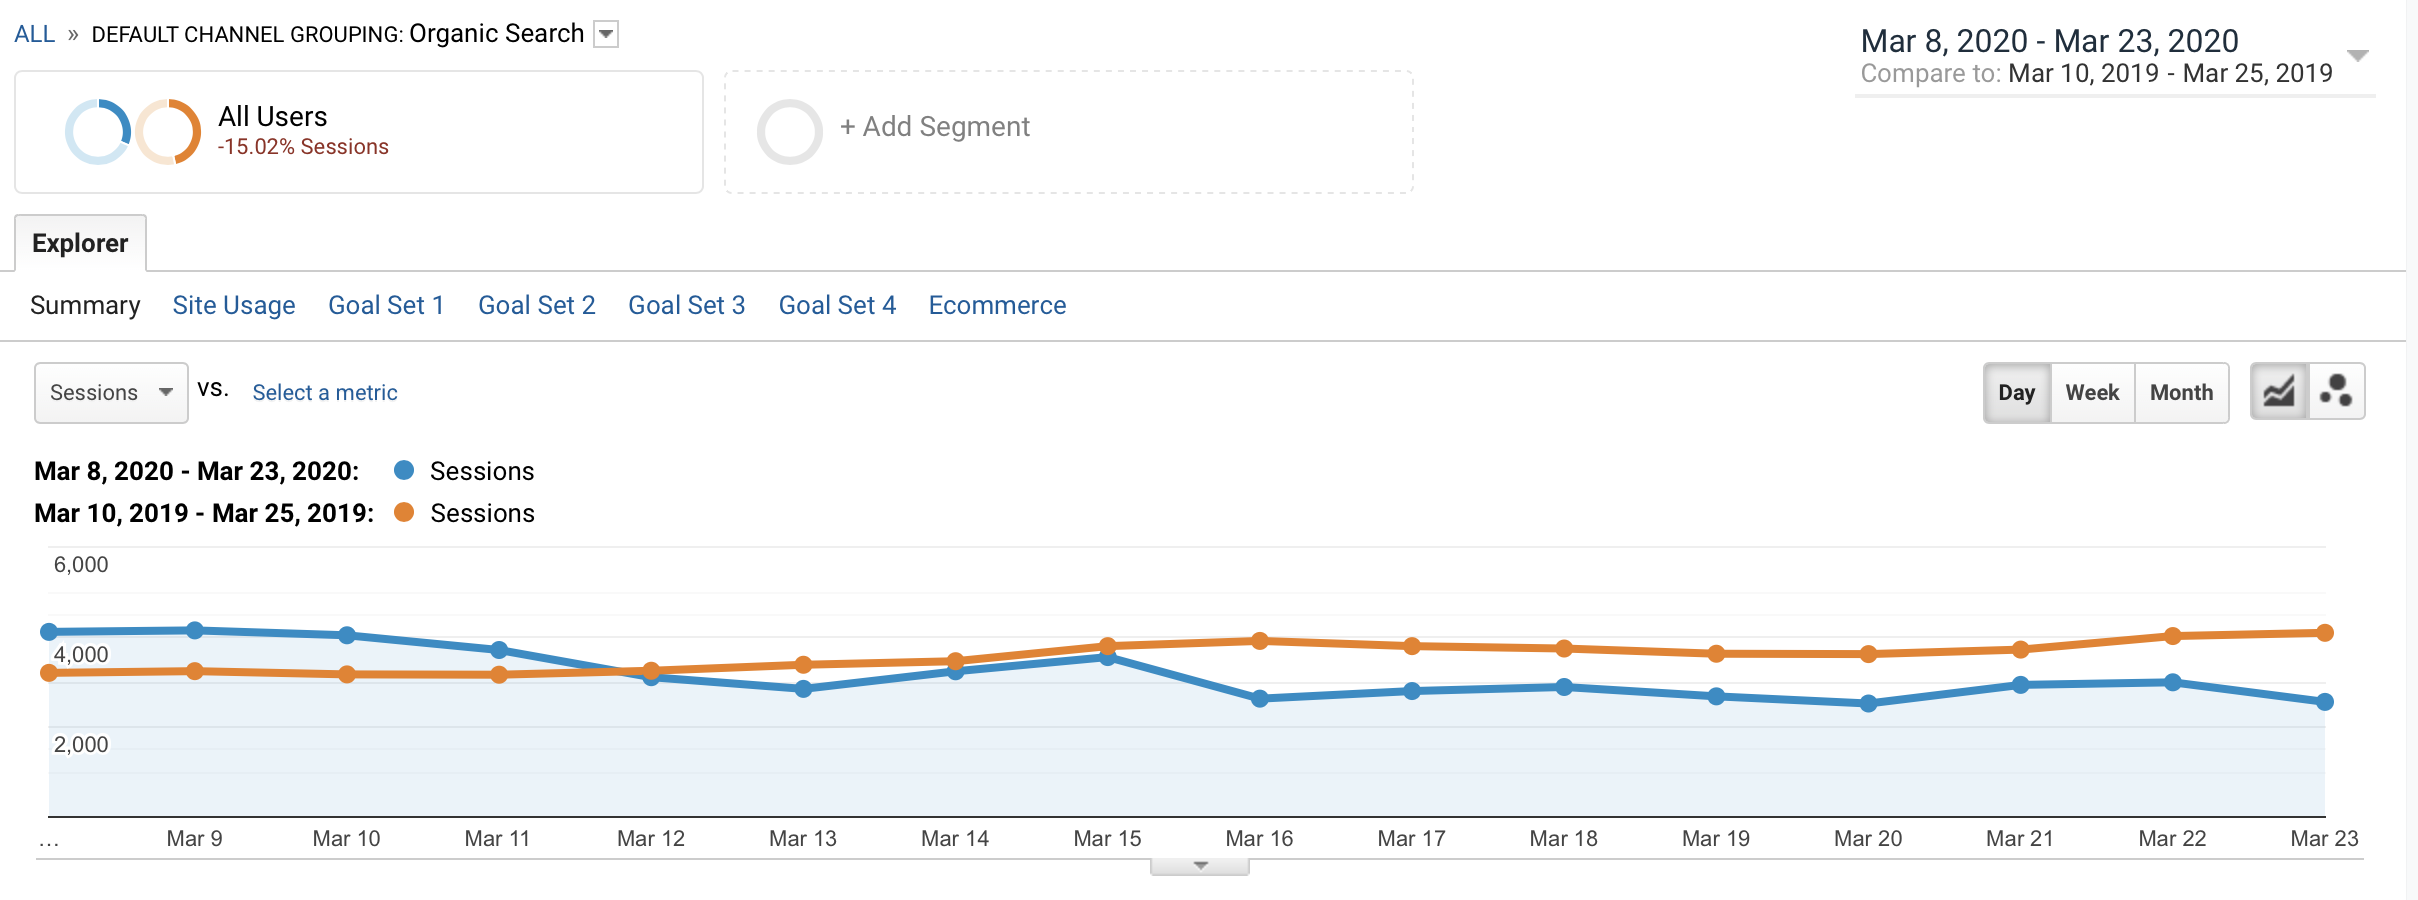
What I am watching for is for the Organic Search Traffic to begin picking up. This is one of the best leading indicators that new business will be picking up.
What About the Global Markets?
We should pay attention to what is going on in the global markets. However, I caution on using global market data, or other countries' data, as a model for what will happen in the United States as we come out of this. You need to filter your interpretation of what is happening in other countries right now, such as China's real estate market and how they are coming out of Coronavirus, to the reality of their economy before Coronavirus. China was not doing well before the Coronavirus. Be very, very careful as you try and correlate trending data from other countries. And only base business decisions on that data when you have a full picture of what is going on in those countries, not just a snapshot of their real estate market.
What Should I Pay Attention to Now?
-
I recommend watching your Google Analytics data for your website. This works best for analyzing data for a real estate firm as opposed to an individual sales associate's website. Specifically, watch your total traffic trends, your organic search traffic and your social media traffic, especially with a year-over-year comparison.
-
Moving forward, I strongly encourage you to get familiar with this type of data trending and use it in your business. You can build your own spreadsheets that you plug your own data into monthly and use the data to make more informed business decisions.
-
You need to be communicating with your people on the realities of today with a vision for tomorrow. Don't get stuck with paralysis in analyzing what is happening. It is good to analyze what is happening and to deal with today, but you must focus and move towards the future. This is one of the reasons I am communicating this information. These are data points you can pay attention to that are actionable.
More to Come
I still have more articles planned for metrics that I am tracking and paying attention to. I want to talk about lead volume and trending. I will share more on this in the next week, but again, the early trending data isn't as negative as I thought it would have been.
I hope to provide you with tools that you find useful in monitoring your business as you navigate the impact of Coronavirus on the real estate industry.
To view the original article, visit the Delta Media Group blog.