
RETECHNOLOGY PREMIUM MARKETPLACE RELATED PRODUCTS | WEBINARS | SPECIAL OFFERS


You are viewing our site as a Broker, Switch Your View:
Agent | Broker Reset Filters to Default Back to ListHow to Deal with Coronavirus in My Business: An Analytical Approach to Business Leading Indicators, Part 1
March 30 2020
 Five weeks ago, I was meeting with 15 business owners, and we were talking about how good business is and how we should be planning for a black swan event. We all agreed that we should as we continued talking about watching our business metrics as all of our businesses were growing at phenomenal rates. Times would be good, and I would have never thought that I would be writing an article just five weeks later in the middle of a black swan event.
But here we are today dealing with the impact of Coronavirus on our lives and businesses.
All of us, while waiting to see what our government will ultimately do in the form of bailouts, are working and planning in our businesses. What I want to draw all of us towards is our business metrics.
At the recent Leading Real Estate Companies of the World (LeadingRE) Conference in Las Vegas, Aaron Geh and I pivoted our speaking session to partially discuss business metrics to pay attention to. In this article, I will attempt to outline what metrics you can pay attention to and how to interpret trending data that you can produce now if you aren't already tracking such data.
Trending Data as Seen Today
During our presentation at The LeadingRE conference, we shared Google Analytics website trending data that showed the early trending data that could be seen from various real estate firms around the country. We specifically showcased two clients in the Pacific Northwest and another client in the Midwest and the different impacts on their website traffic. The differences were dramatic.
We began seeing these changes in many markets, at varying levels, starting mid to late February. Below you can see a screenshot of a Google Trends graph showing the interest in web-related searches on the search term Coronavirus. This is a good tool to showcase consumer behavior and interest.
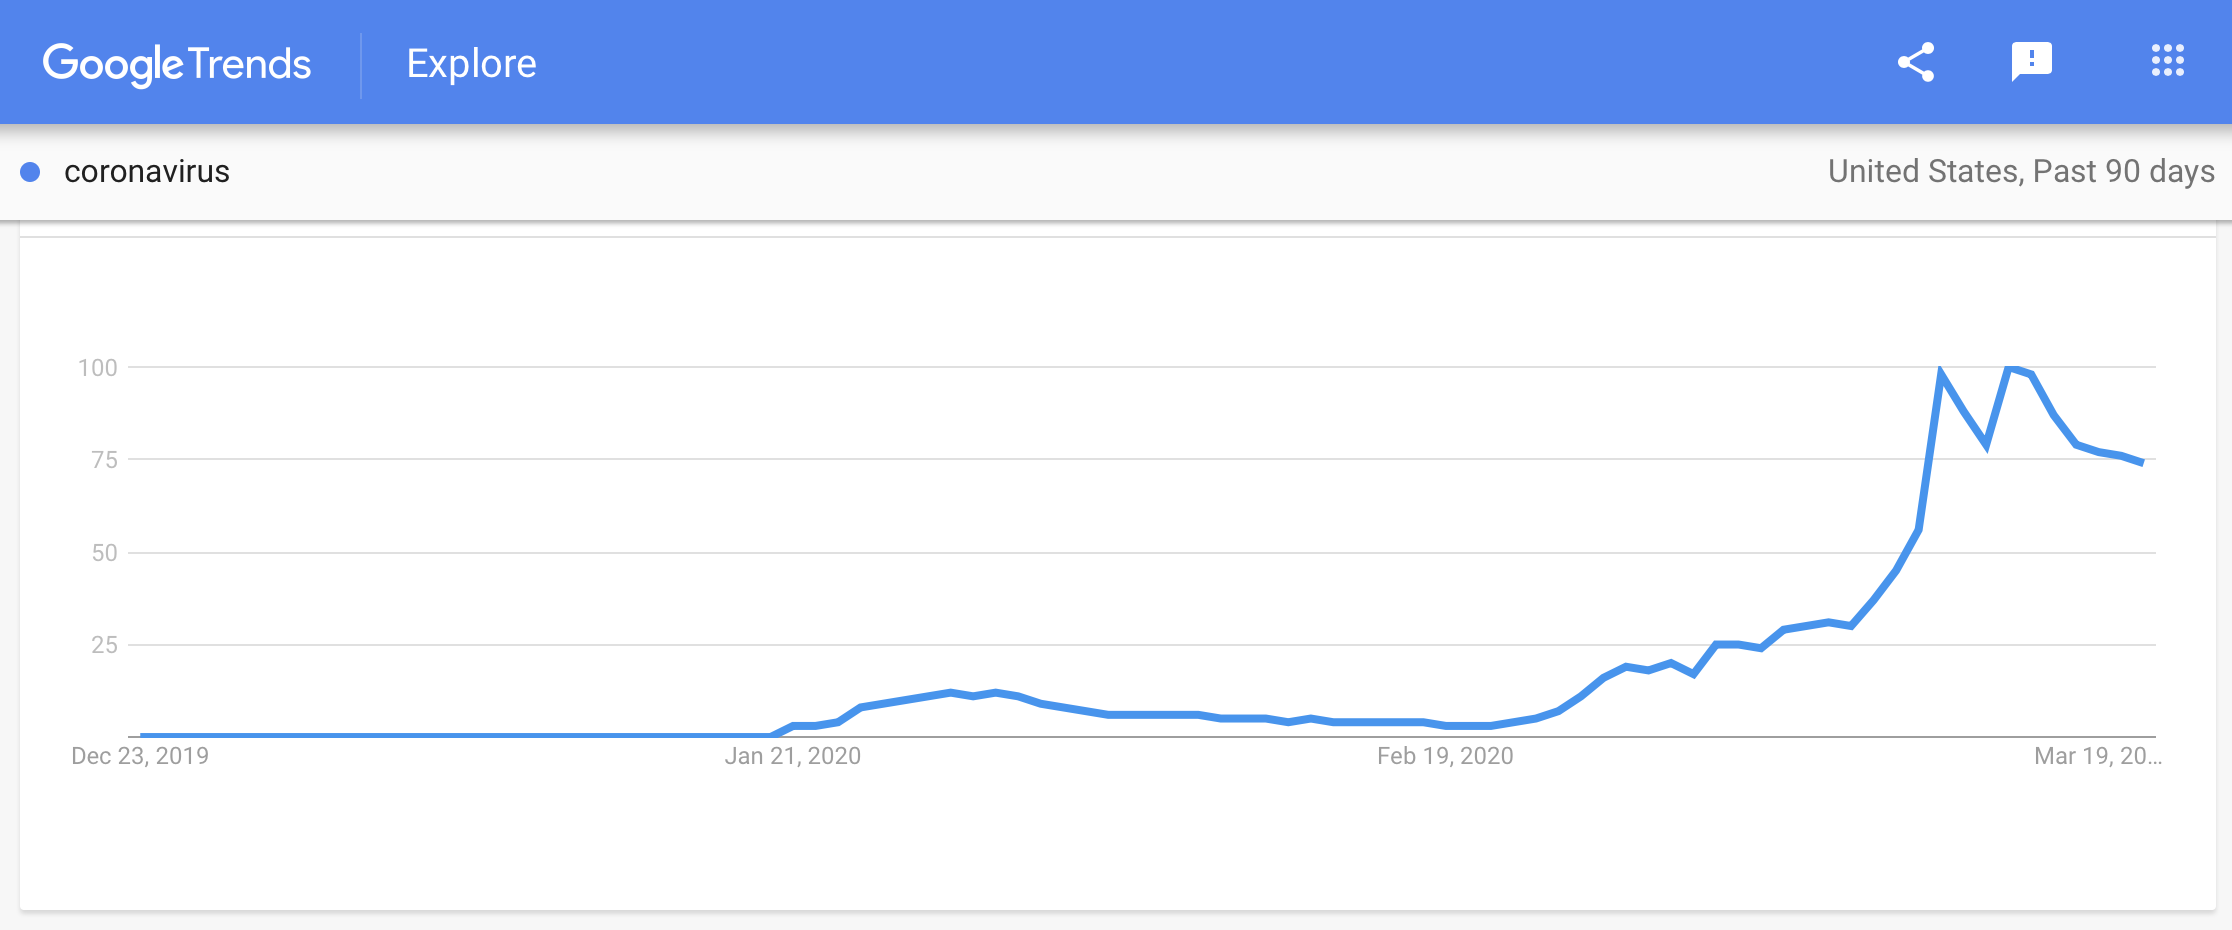
Correlating the Google Trends search data into the impact on activity on real estate websites is very easy. When the data was overlaid with our client website traffic data, we saw a direct correlation, and negative impact, on Organic Search Traffic to websites during the same period.
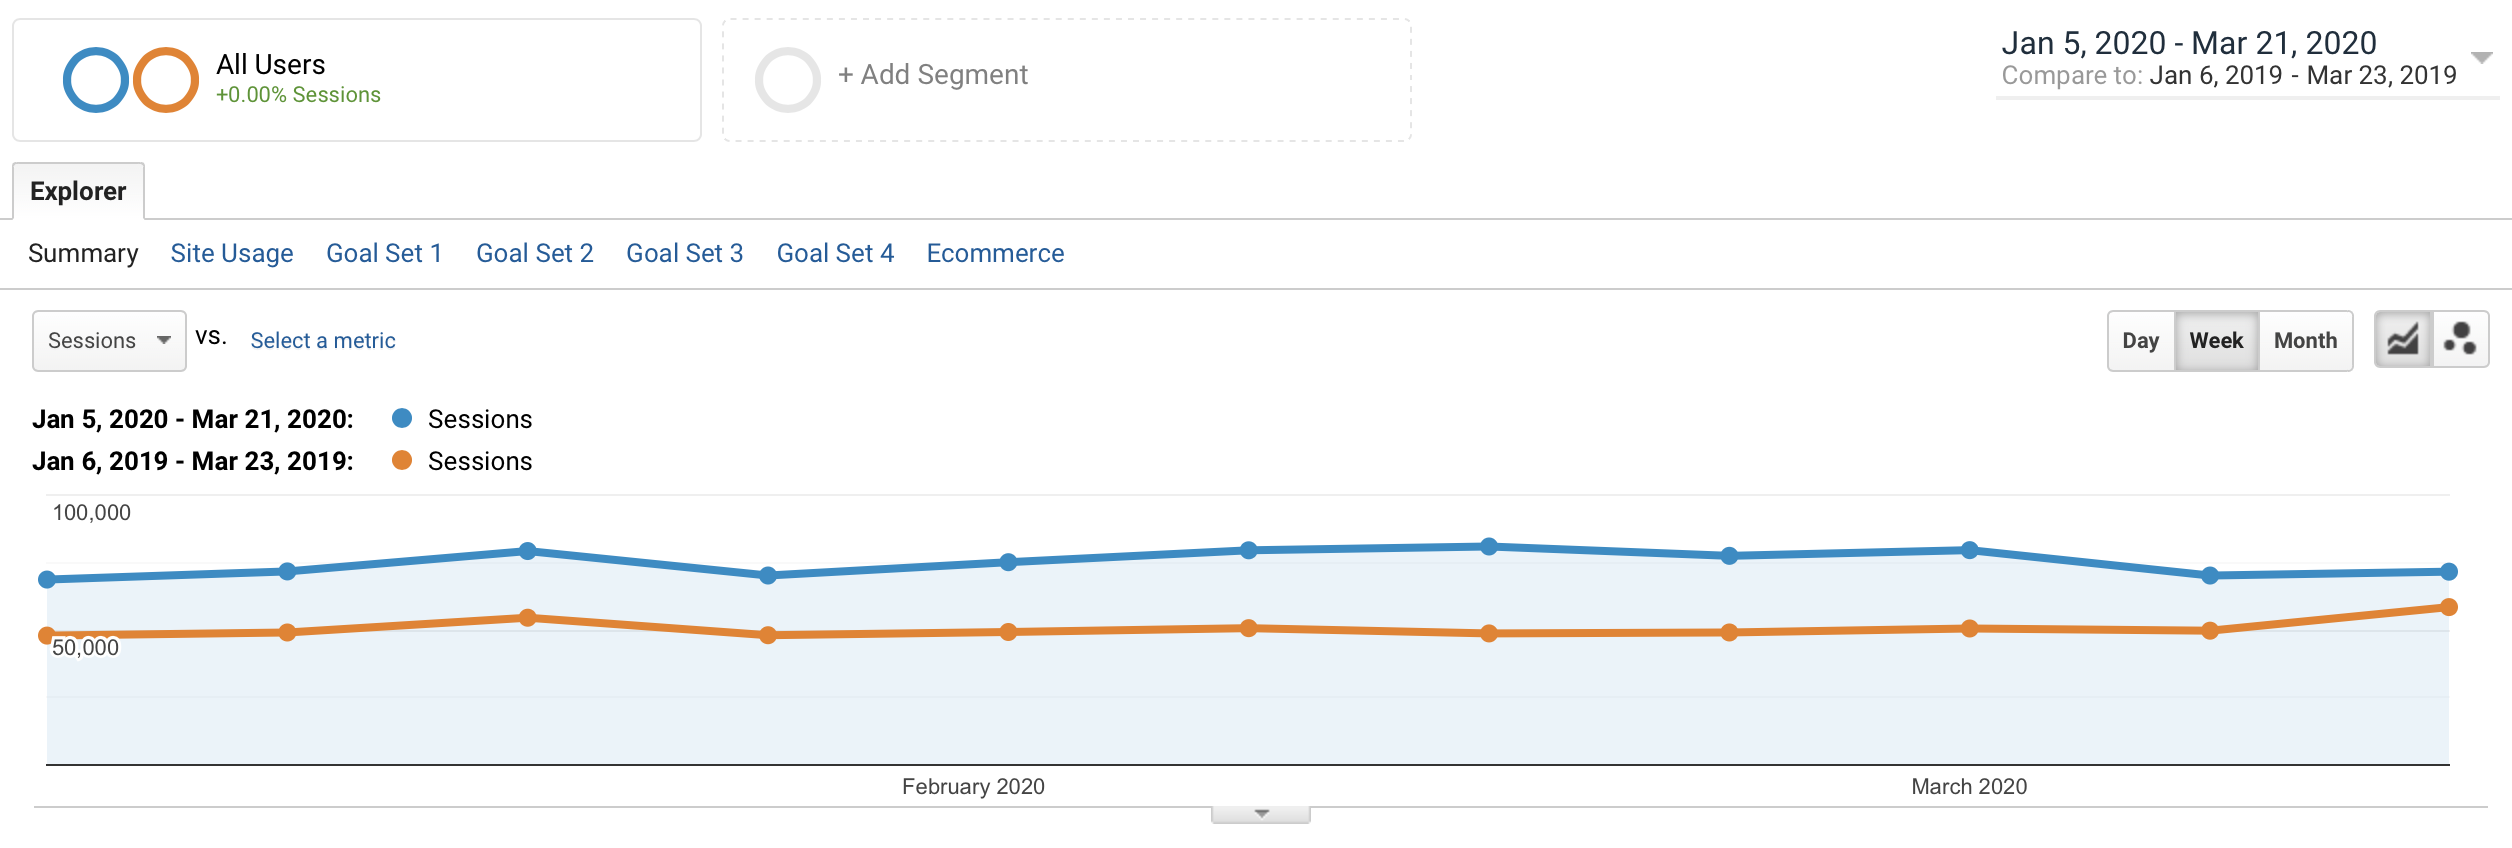
The following graph shows the drop of one client located in the Midwest showcasing the drop in their website traffic trending. It is important to note that their traffic trending for 2020 was previously an increase of 52% over 2019, but has shifted to being up by only 46% in the past week.
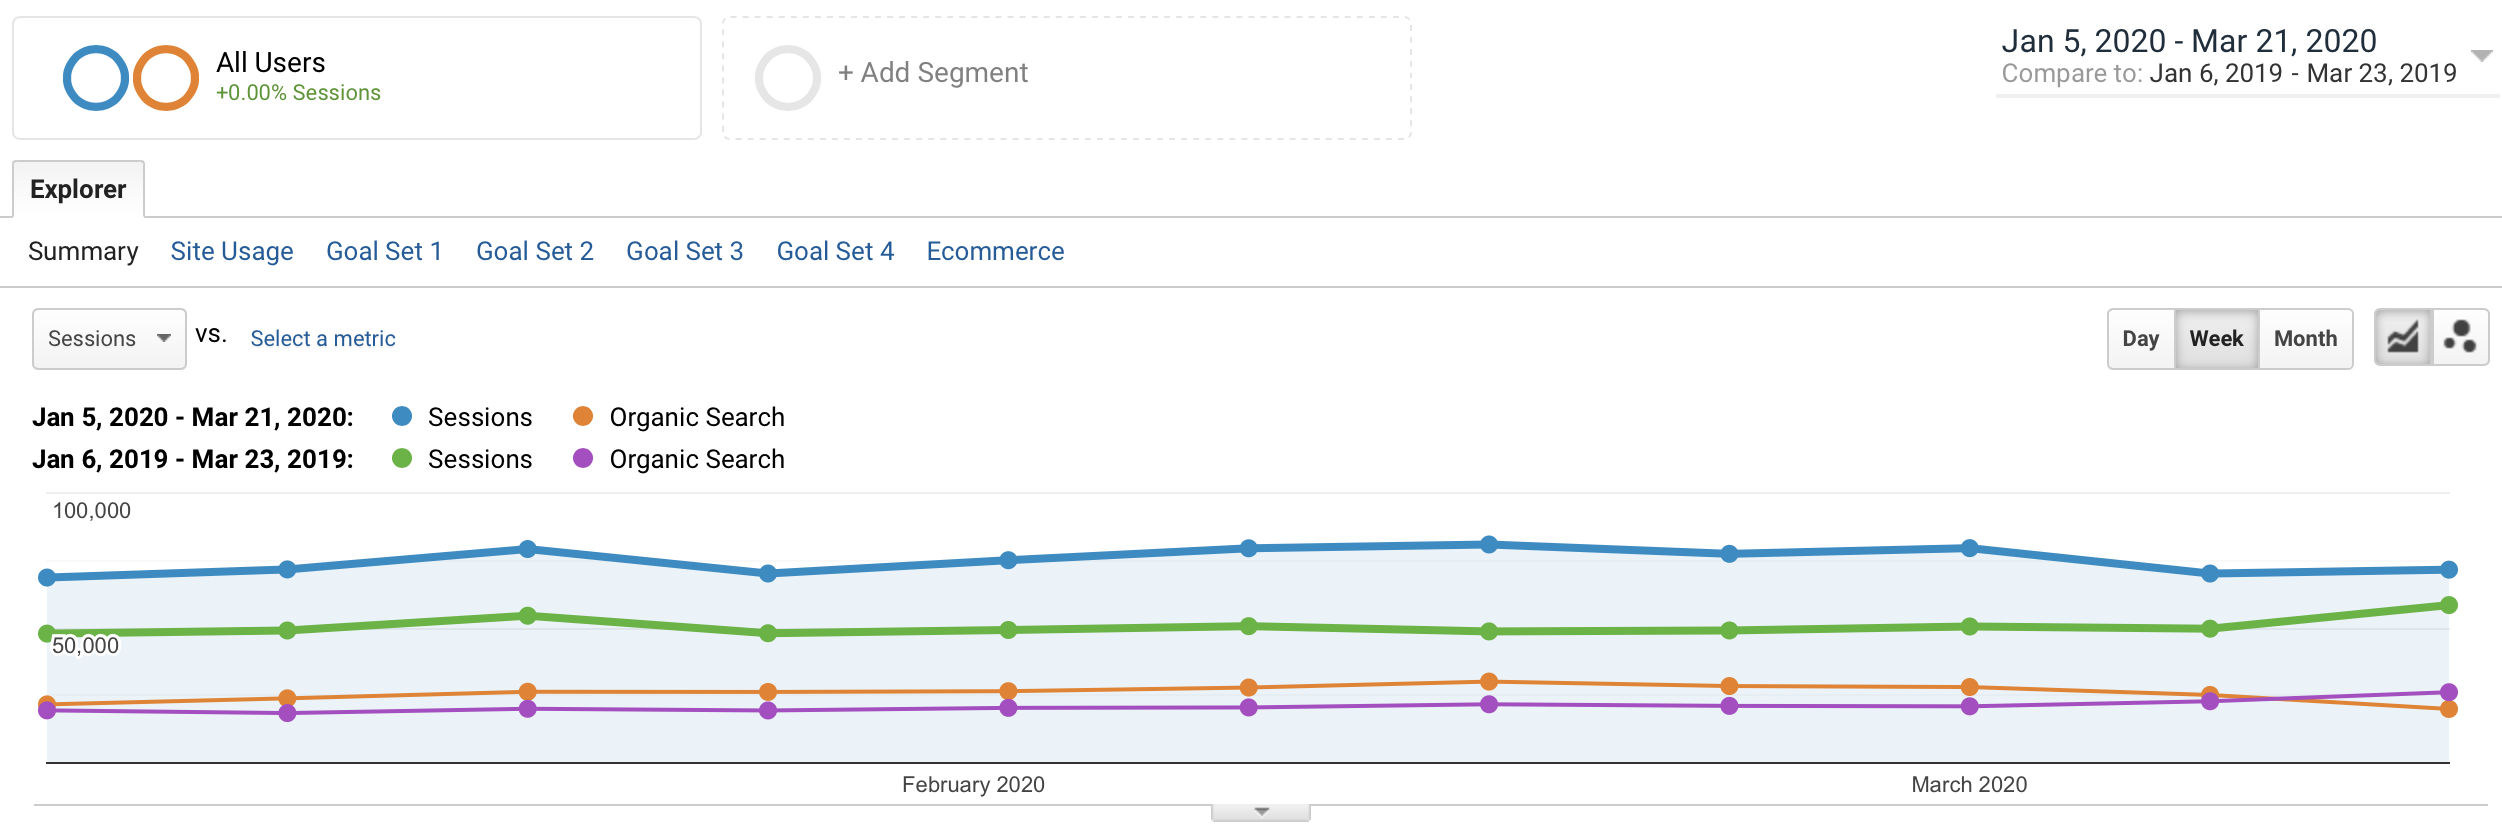
The drop in traffic in the above chart may not be clear, but when Organic Search Traffic is added to the Google Analytics graph, it becomes more apparent, as you can see in the graph below. In this graph, you can clearly see that Organic Search Traffic has dropped. Previously, Organic Search Traffic was up 31.1%, but Organic Search Traffic this past week is now down 23.7%.
Trending Data You Need to Pay Attention to
One of the most important data metrics I believe you can pay attention to for your business in this time is your website traffic, and specifically the trending of your Organic Search Traffic.
You need to be paying attention to the overall trending of your traffic from the beginning of January through today and interpret that data accordingly. This is one of the best leading indicators you can pay attention to in understanding when your business may be trending back up.
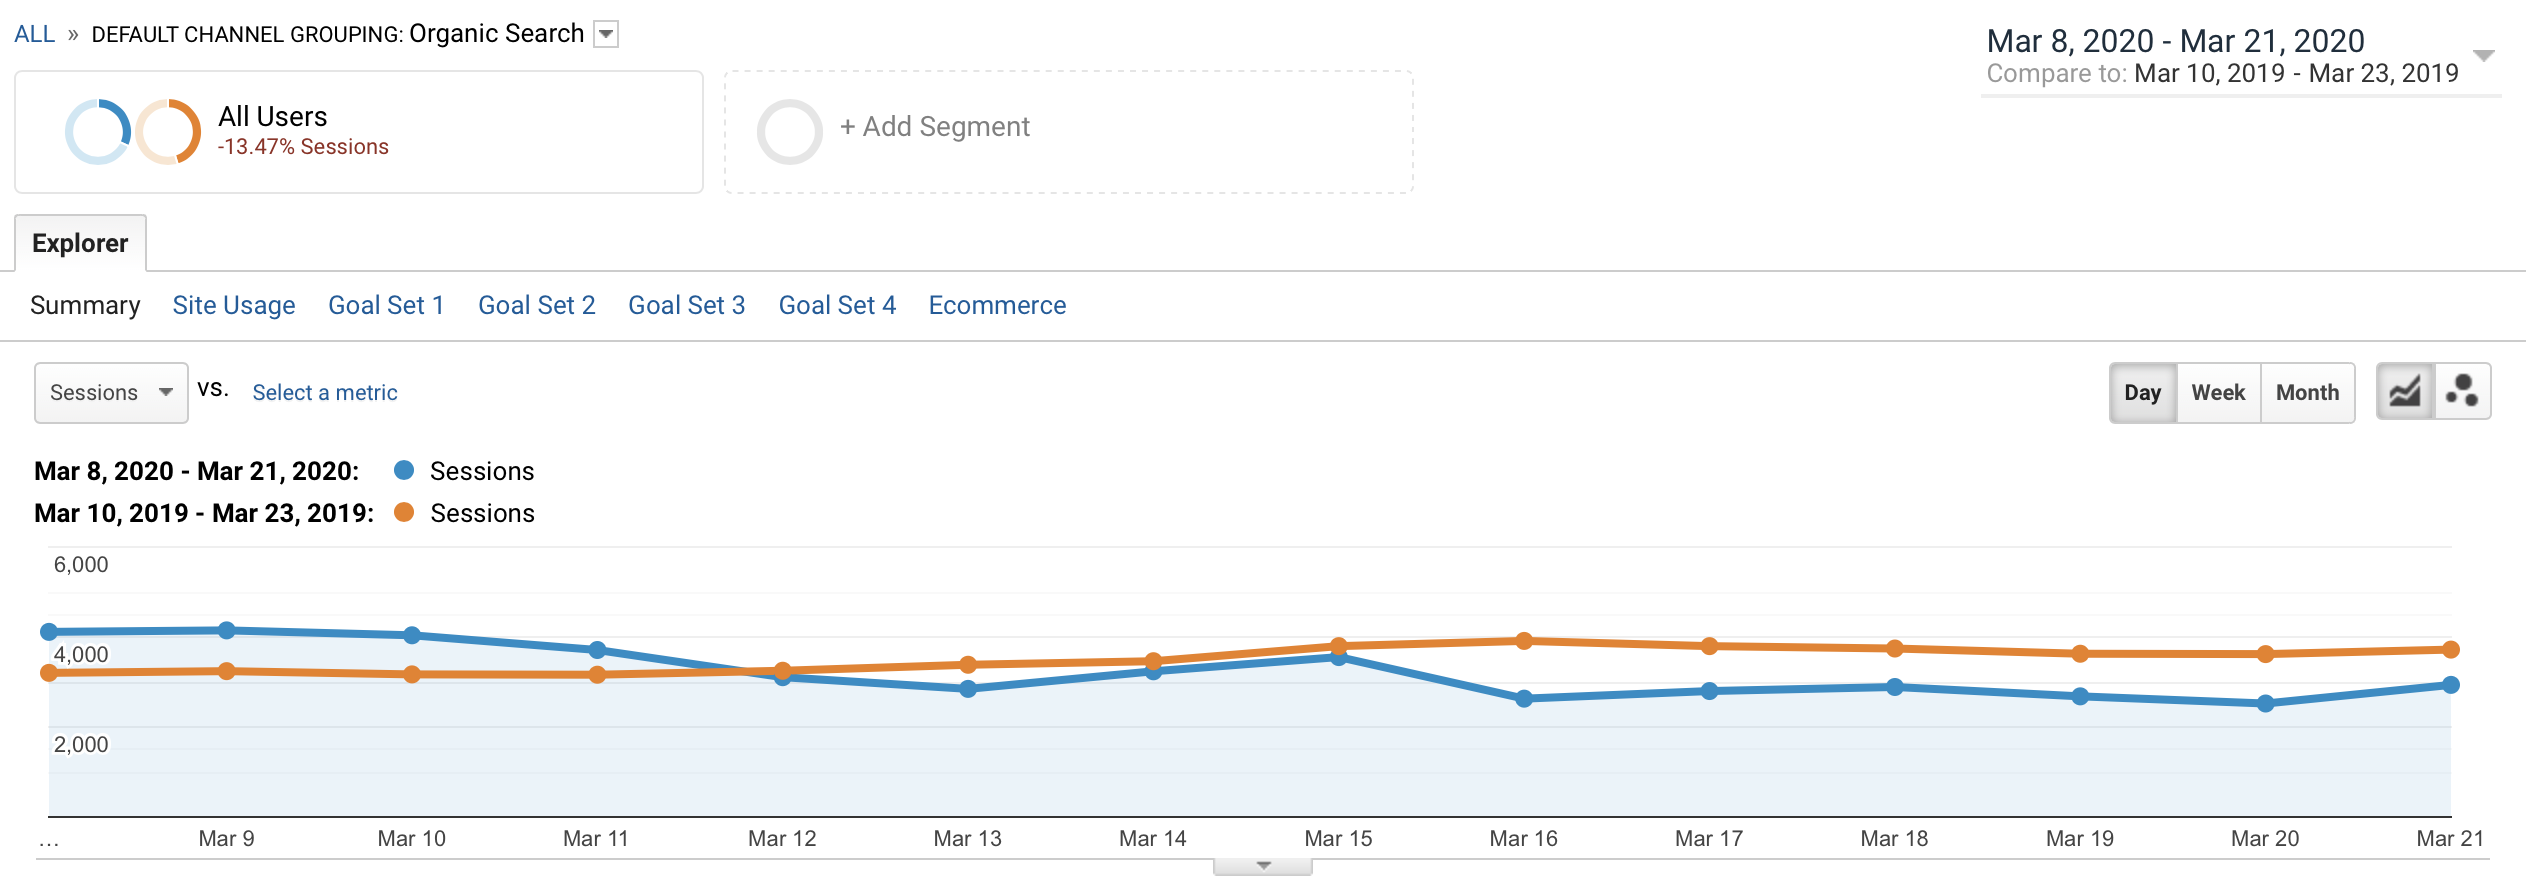
The graph below shows Organic Search Traffic over the past two weeks for this website (comparing March 8 through March 21, 2020 to March 10 through March 23, 2019) showing the dip in Organic Search Traffic. What we need to watch for is a trend where the Organic Search Traffic trends back up to similar levels they were at previously, taking into consideration the seasonality of your website traffic trending.
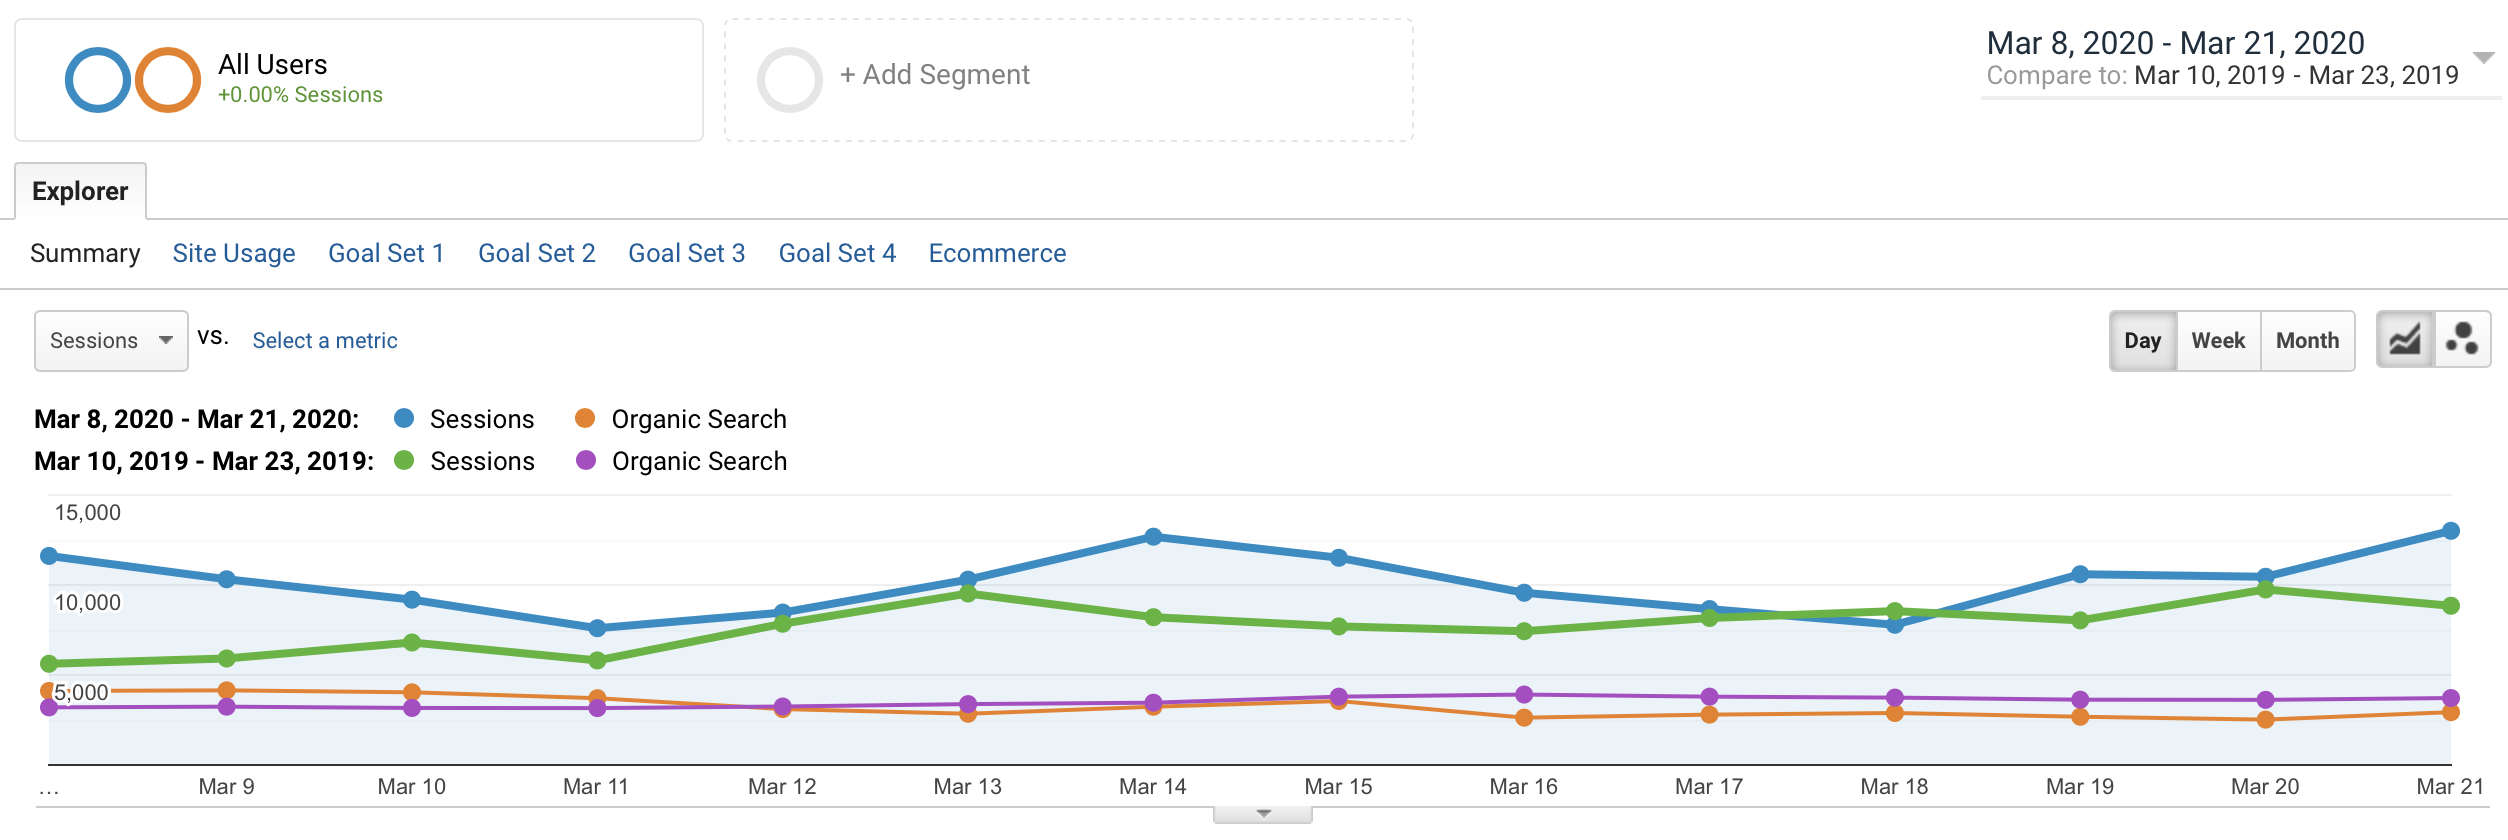
As you pay attention to your Organic Search website traffic trending, you also need to pay attention to your total website traffic. Your total website traffic will also show trending that is important to pay attention to. Currently, engaged clients will directly engage with your website through direct traffic and additional sources such as email traffic from emails such as new listing notifications. The graph below shows both Total Traffic and Organic Search Traffic during the same time period year over year (comparing March 8 through March 21, 2020 to March 10 through March 23, 2019).
More to Come
I have at least two more articles planned for metrics that I am tracking and paying attention to.
The first is lead volume and trending. I will share more on this next week, but at least for now, the early trending data isn't as negative as I thought it would have been.
The second is the rate of change trending data analysis. I will share more on this soon, but one of the most important tools I have used since 2010 is 3/12 and 12/12 Rate of Change applied to metrics. I use this metric extensively in analyzing changes to our SEO platform, cash flow, and my business leading indicators. Doing this type of analysis helps me understand how to interpret the trending data for early leading indicators of increasing trending in growth, decreasing growth trending and knowing when times of contraction are ending and growth is being experienced but not yet "felt" in the business.
To view the original article, visit the Delta Media Group blog.