You are viewing our site as a Broker, Switch Your View:
Agent | Broker Reset Filters to Default Back to List6 Kinds of Infographics to Use in Real Estate Marketing
September 17 2019
The real estate business is competitive. Marketers are competing for attention in the same arenas for similar audience profiles. With the digital sphere clogged with information, it is becoming harder for marketers to get their content noticed.
While content marketing efforts make a difference in the amount of engagement real estate agencies receive, the best way to captivate an audience is by using strong visuals, like high quality images, charts, and infographics. But not all marketers have access to graphic designers nor the time or ability to start learning graphic design software to make such visuals.
Fortunately, there are online resources now available to real estate marketers that offer stunning infographic templates, all of which are customizable and shareable. Today we will be looking at the six kinds of infographics you can use as a real estate marketer.
1. Icon Infographic
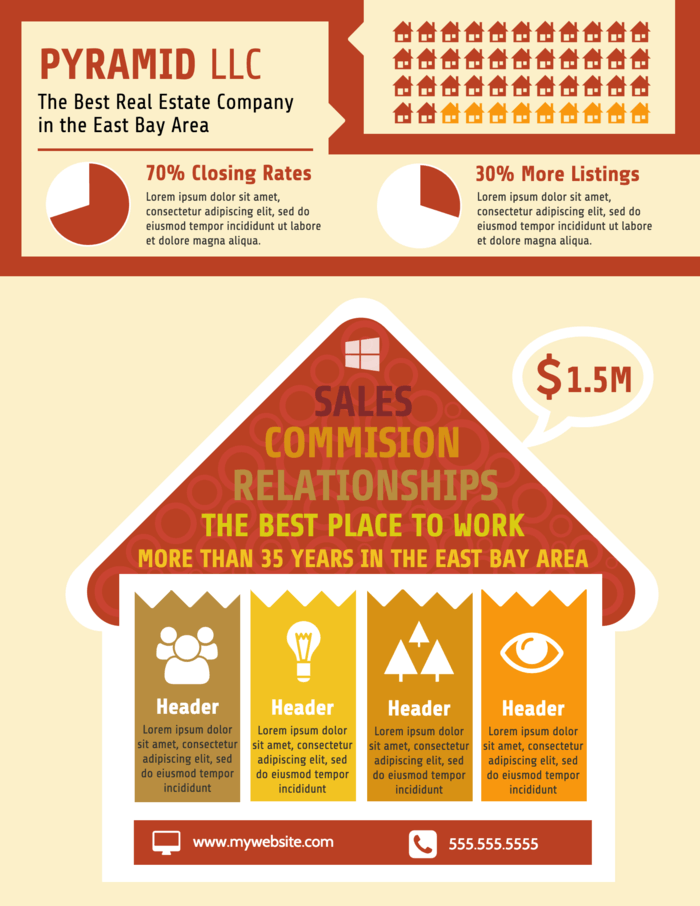
The icon infographic is a style that is both visually appealing and fun. Unlike most other visuals that combine photos and text, the icon infographic almost exclusively uses icons to tell its story, like in the example below. Anyone wondering why a marketer would create a graphic using only icons needs to know that icons are an excellent visual tool. Icons, like emojis, convey a great deal of information easily and quickly. They act as a universal language—almost everyone knows that a suitcase depicts business or work, and that a bulb equates to an idea or electricity.

Given context, an icon can speak a hundred words. Icons are economical in the space they take up and how effectively they convey messages. Making an icon infographic saves marketers the trouble of having to source high quality images, while still making an attractive infographic that will draw in potential clients.
2. Informational Infographic
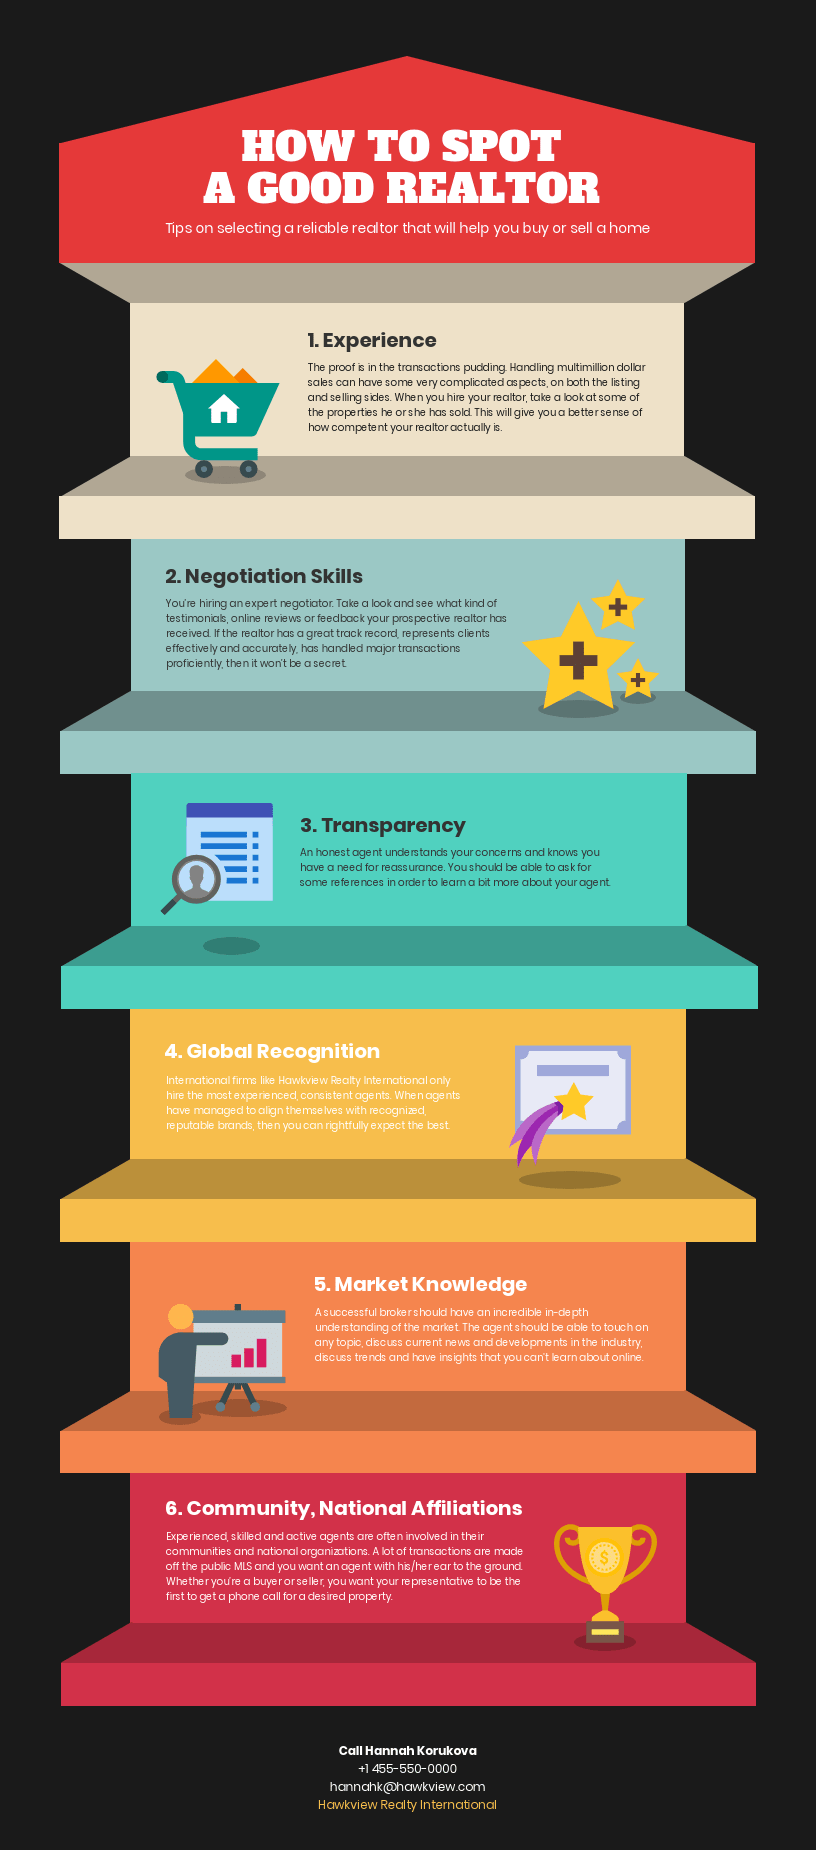
The most popular kind of infographic is the informational infographic. Informational infographics tend to be longer and include blocks of text. They aren't text-heavy though. Its layout is similar to a blog, in the sense that informational infographics have sections, sub-sections, as well as bullet points and lists. These infographics, like the example below, give a thorough overview of an entire topic.

Informational infographics are great for communicating a large amount of information or for clarifying a particular subject. When creating one, it is important to avoid being too wordy. Keep your sections short and precise. Use headers, icons, or bullet points to divide segments. Incorporate illustrations and a varied color palette to keep audiences engaged. You can also look at numbering sections or using directional signage to help the reader follow the path of information you have provided. An informational infographic needn't be dense to still be packed with easily digestible information.
3. List Infographic
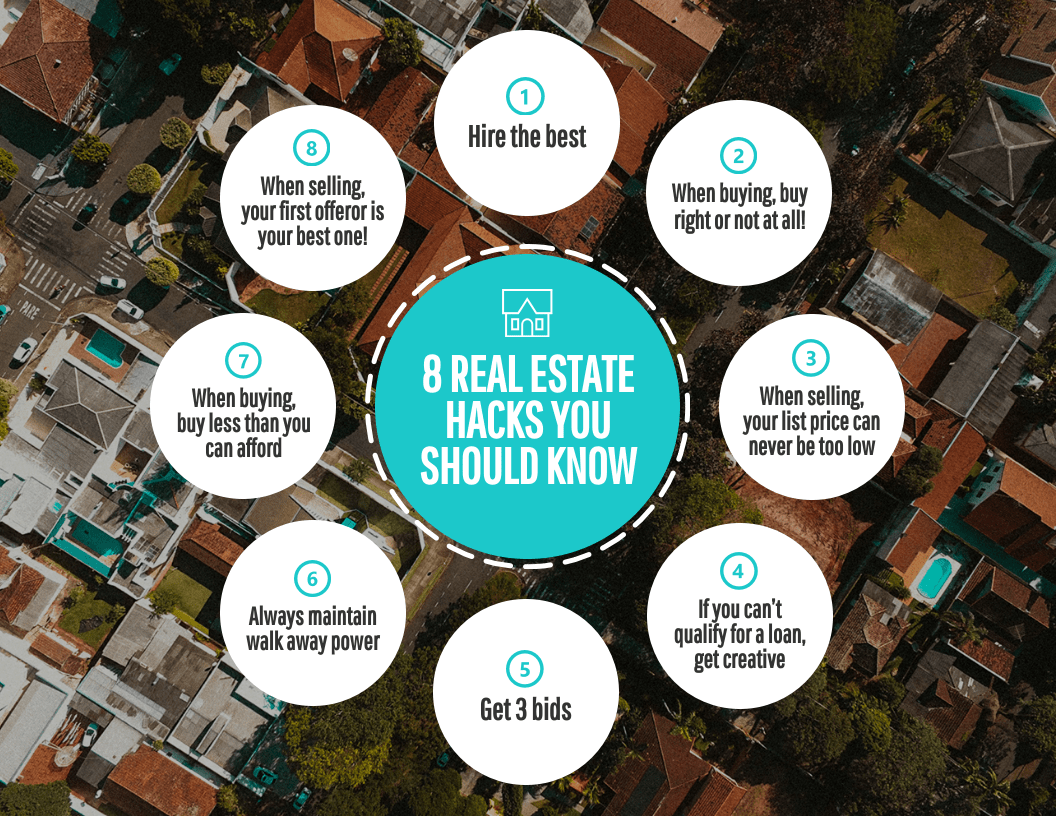
People love reading lists. They are easy to follow, have a convenient layout, and are shareable. What could make a list even more attractive to readers? Adding visual elements like colors, icons and fonts, like you would do with an infographic. When you are trying to promote your real estate services, creating a list infographic makes a lot of sense.

What we have seen with informational infographics is that adding numbers to sections of your infographic makes it easier for readers to follow the text, as you can see in the example below. The list infographic is evenly divided into sections, each with their own numbers and icons. This makes it easy for the reader to follow and absorb the information provided. Though this is a standard list layout, you can play around with how you present your list. This list infographic example has a completely different layout while still leveraging the power of lists to inform and engage readers.

List infographics are a great way to succinctly share information with your audience. They are also engaging and attractive, which will increase engagement rates for your content.
4. Process Infographic
The process infographic is a great way to illustrate the steps of a process. The layout of a process infographic allows the marketer to clearly outline each step. While most process infographics have a standard top-to-bottom list layout, this is not a style that you have to adhere to.
As you can see in the below example, the process infographic is divided into sections and uses a series of icons to share information with the reader. Numbering each step of the process is an important part of creating a strong process infographic. It also helps to add visual cues like arrows, but it isn't always necessary.
A process infographic is a great way to highlight steps to a reader in a concise manner that engages and interests them. This is the kind of visual that leaves nothing up to interpretation—which makes it a good tool for information sharing.

5. Report Infographic
There are a variety of reporting methods a real estate agent has access to, but at the end of the day, if your audience isn't reading your report, then that time and effort has been wasted.
While reports require a great deal of work to put together, most potential clients don't have the time to read about the market rate for rent or changes in mortgage rates, even though it is important information for them. How do you convey your messages to your clients in a way that will engage them? By using report infographics.

Infographics are largely seen as methods of attracting and entertaining clients, but real estate marketers can also use them as the basis for sharing important data. As you can see in the report infographic below, this is an excellent visual that gives readers a large amount of relevant information without boring them.
The report would likely have translated to 20 (or more) pages of written material, and would have required as much effort to put together. But with a template like this, you can slot in the data you have so you increase your chances of engaging with clients. A report infographic does the work of a written report, except it utilizes graphics, icons, data and visualization to present it in a more easy-to-absorb fashion.
6. Statistical Infographic
Similar to the report infographic, the statistical infographic leverages the power of data to entice customers and clients to engage with you. They are very data-driven, and generally incorporate a large number of graphs and charts, as you can see in the below example. But a statistical infographic needn't follow any standard format. You can use almost any template to share your data as long as it is clear and precise.
If you want to highlight certain data segments over others, make them larger, bolder, or accentuate their presence with colors or icons. One mistake that marketers may be tempted to make with regards to statistical infographics is to use a random set of data in one infographic. This is not the best way to leverage this visual. There has to be some context or story to your data—what are you trying to tell your audience? Once you know the story, you can put the data together in a format that will inform and engage your readers.

Conclusion
There are a number of infographics available to real estate marketers. The six that we have highlighted in this article will make it far easier for marketers to leverage the buyer journey and increase their client base.
All real estate infographics provided by Venngage.
To view the original article, visit the Transactly blog.


