
RETECHNOLOGY PREMIUM MARKETPLACE RELATED PRODUCTS | WEBINARS | SPECIAL OFFERS


You are viewing our site as an Agent, Switch Your View:
Agent | Broker Reset Filters to Default Back to ListFind the Local Market that Offers the Best Growth Opportunity
June 28 2017
Selecting and working in the wrong local market is a costly mistake that many real estate professionals make. But with some background knowledge, it's an error that you can avoid.
If you selected your current Local Market based on the following factors, you may want to reconsider (and we will show the tools to do this, below):
- I live in this neighborhood;
- I like the area, the homes are nice;
- Other agents are marketing there, so I should too;
- I've got a listing there
The reasons for choosing a local market area above aren't wrong, but they shouldn't be your sole reasoning. In this article, we'll look at how to select the best Local Market area—one that you can master (and be profitable in). To achieve this, we'll need to do some calculations (which we will walk you through step by step).
Learn how to:
- Calculate the opportunity of a geographic area;
- Calculate the potential future opportunities of a particular market area;
- Look at other variables that will affect the Local Market you choose.
To get started, grab a calculator, a pad of paper, and a pen. Let's get started!
Calculate turnover rate
The turnover rate is the percentage of homes that will sell in a given time period compared to the total number of homes in a specific area.
Example:
If there are 500 homes in a specific local market, and 50 of those homes sold in the last 12 months, the turnover rate of that particular area is 10 percent (50/500 = 10%).
In plain English, that indicates that 10 percent of the homes in a particular area sold in the last 12 months.
How to calculate the turnover rate of a particular neighborhood:
Two pieces of info that you will need in order to calculate the turnover rate:
- How many homes are in your neighborhood?
- How many homes have sold in that neighborhood?
There are two ways to determine the number of homes in your neighborhood. The first way is through the local tax records. The second way is to call your title company's representative who will know how many homes are in that geographical area.
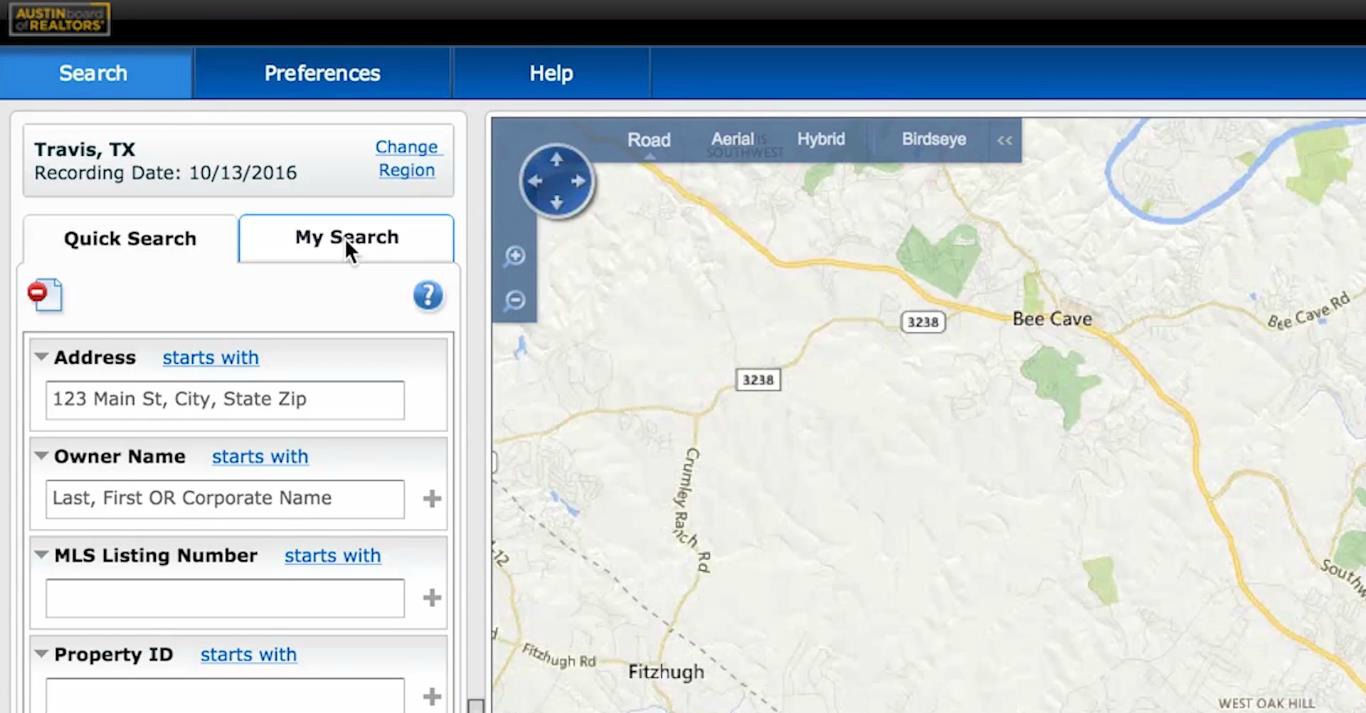
Here we will source that information using tax records on Real List, which ties into our public tax records (your screen and search will differ depending on the platform you are using).
Garry Wise, luxury broker at Goodlife Luxury and The Paperless Agent co-founder, has a local market of Barton Creek in Austin, Texas, which we'll use as an example. First, we drew a polygon around the neighborhood to be assessed.
Garry's tip: look at neighborhoods that have multiple streets going in and out (we'll look at the profound effect this has on marketing your open houses in a future article).
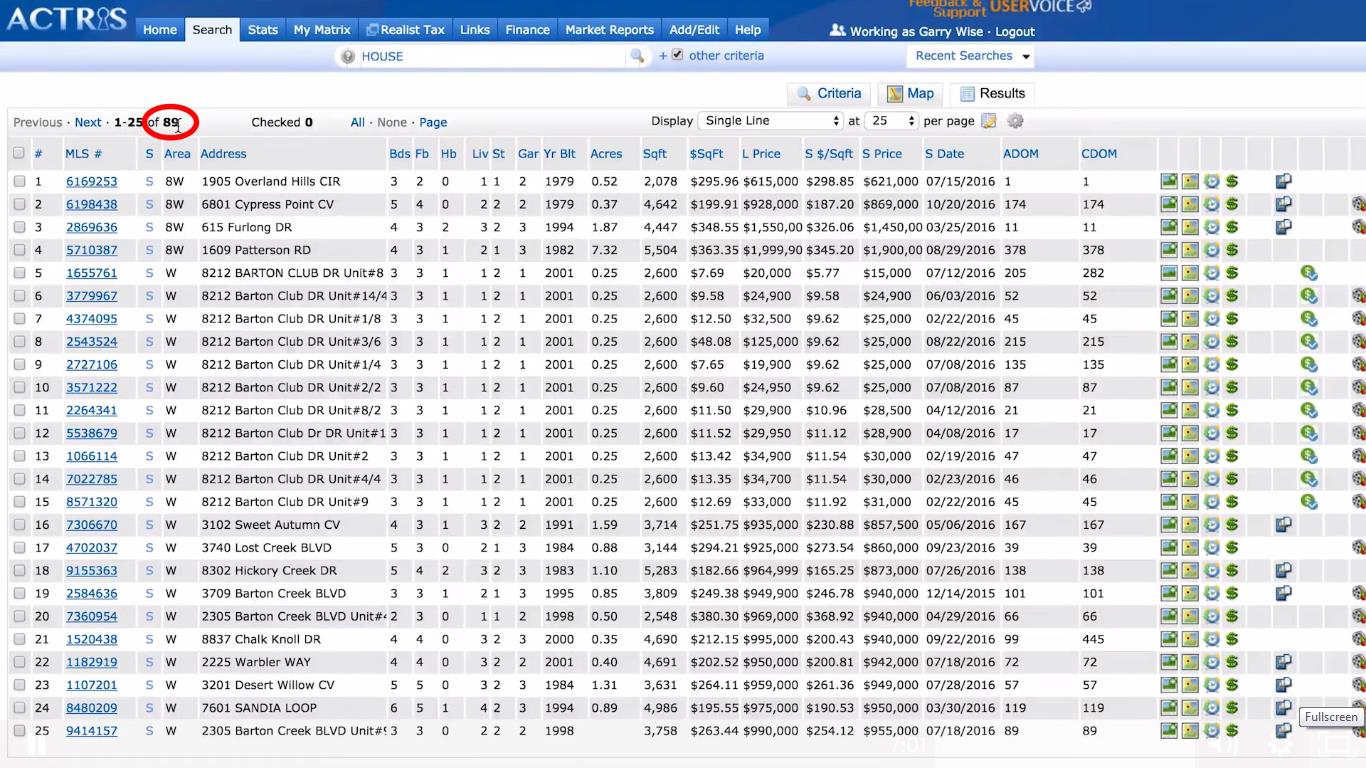
Now hit search (for us, this is at the bottom left of our screen) and a list of all the homes in the area will come up. In this example, a total of 890 properties were listed in this area (this number is important for our calculations, so write it down).
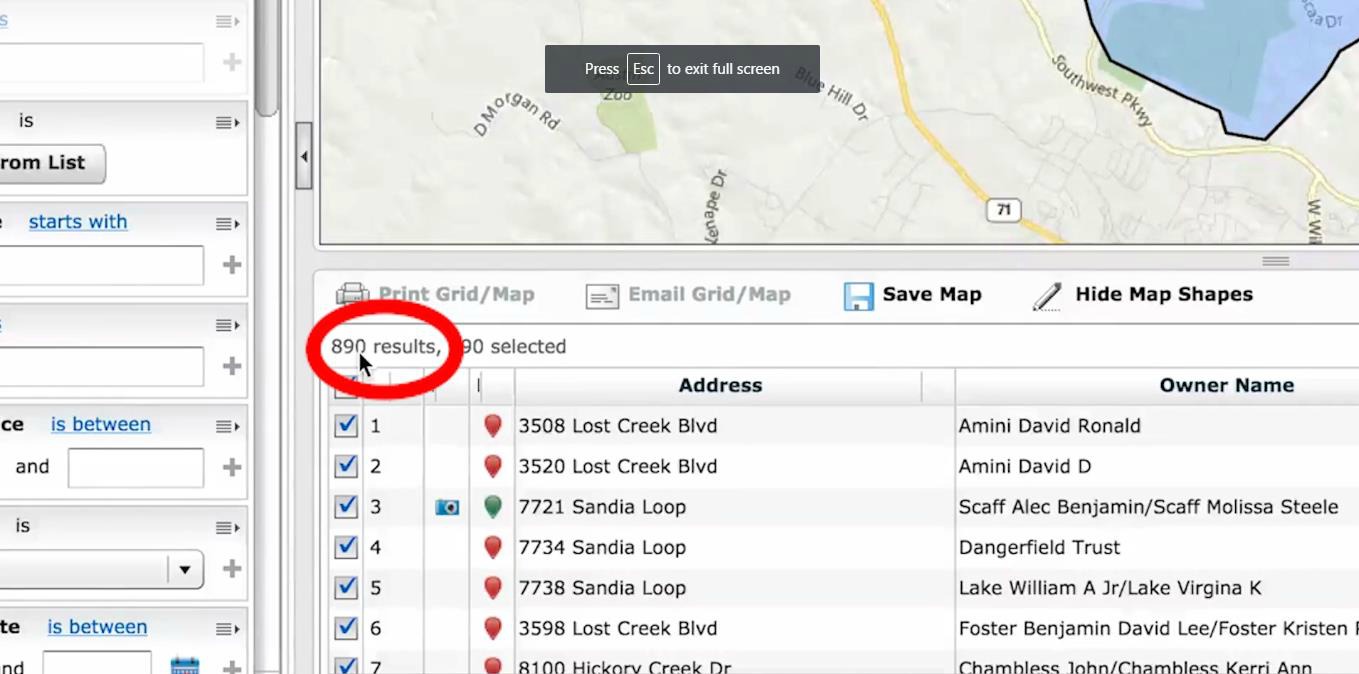
If this is the first geographical area that you are trying to master, we recommend focusing on an neighborhood that has no more than 500-1000 homes. The more homes in a given neighborhood, the higher it costs to successfully execute the marketing strategy.
TIP: Don't exceed your limits! On average, you are going to spend $1 per month for every home in that area to run a successful marketing campaign.
The next step is to go into the MLS and create that same search in the Map tab.
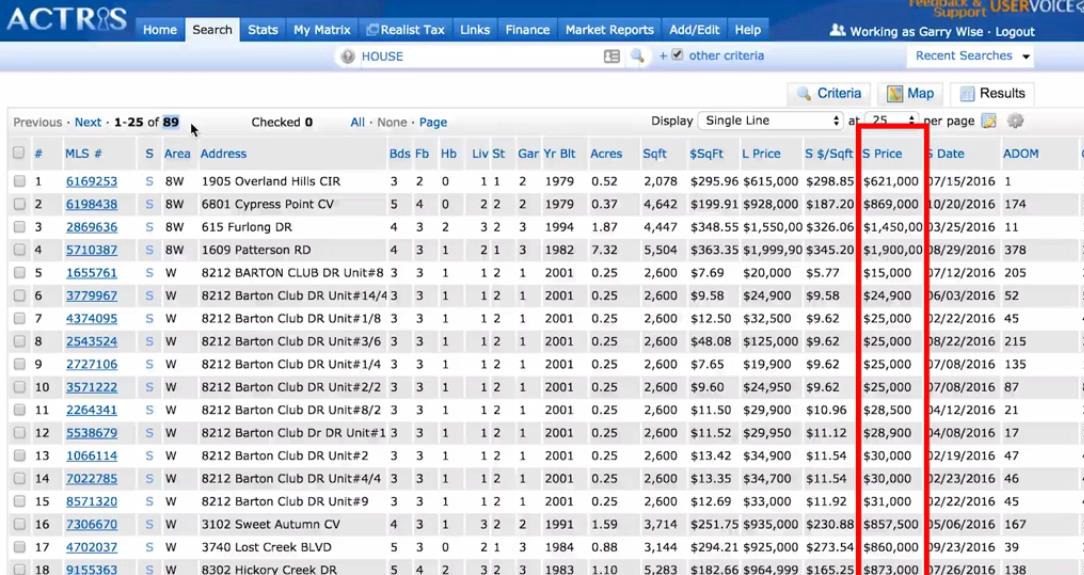
Then go back to the Criteria tab to see how many homes sold in the last 365 days.
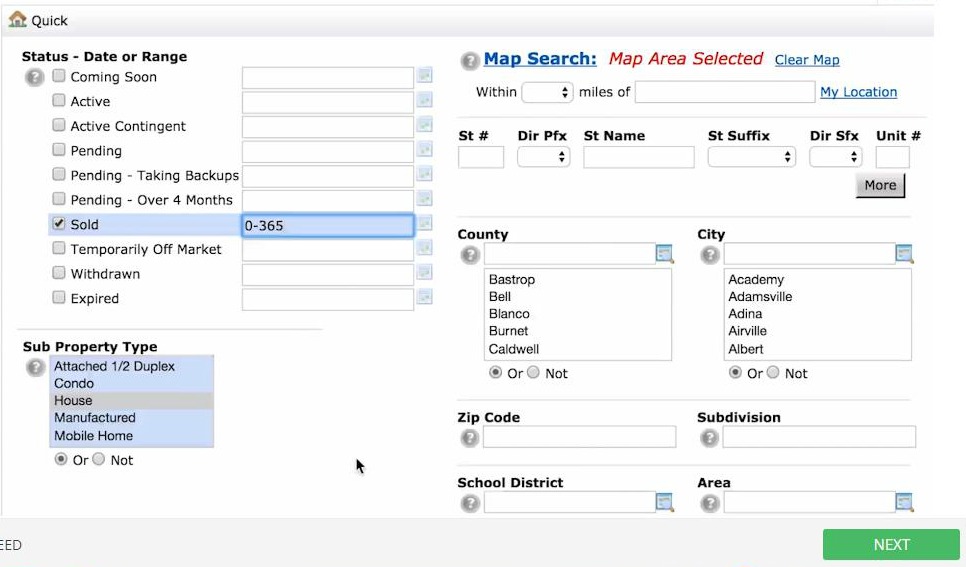
In our particular area, we see that 89 homes sold in the last 365 days.
Looking at the past 365 days is fine for a stable market, but to get a true sense of what is happening, look back over three years to see if any given year was one of unusual activity (an up or down swing) and then average out to an average of homes sold per year.
To calculate the turnover rate for this neighborhood:
Number of Homes Sold in the area ÷ Number of Homes in the Area x 100 (to find percentage) = Turnover Rate
Now sub in the numbers from our example above:
89 homes ÷ 890 homes x 100 = 10%
In other words, 10 percent of the homes in that particular area were sold in the past year.
It's important to look at the average sales price as well; a general (although not set in stone) guideline is that as the sales prices go up, the turnover goes down (this isn't always the case, but it is something to keep in mind).
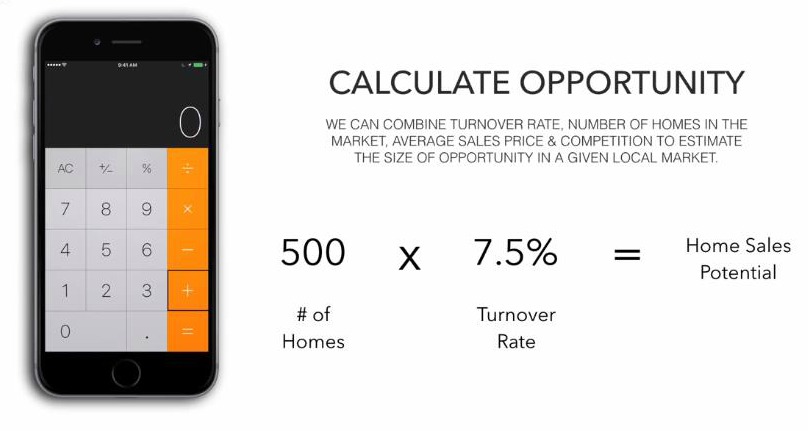
Calculate opportunity in a geographical area
The Home Sales Potential is the number of homes that will statistically sell in a particular neighborhood in a given year.
To calculate the opportunity in a given market, you will need to look at the Turnover Rate, the Number of Homes, the average sales price, and competition in the market.
Number of Homes x Turnover Rate = Home Sales Potential
To calculate this, you need the Number of Homes in the geographical region and the Turnover Rate (that is the number that we already calculated above).
To illustrate the point, we are going to Calculate Opportunity based on a geographical area of 500 homes and a turnover rate of 7.5 percent.
As in the graphic above:
500 x 7.5% = 37.5
In other words, in this particular neighborhood of 500 homes, 37 or 38 will sell each year.
Home Sales Target for the Geographical Area
The next step is to calculate Home Sales Target for this geographical area using the home sales percentage that you just figured out.
Homes Sales Potential x Market Share = Home Sales Target
We can't expect to jump into a new area and immediately have 40 percent market share, so be conservative with this number (5-10 percent is a good place to start your calculations).
Continuing with our sample scenario and estimating a 10 percent market share:
37.5 x 10% = 3.75 homes to sell over the next 12 months
Therefore, your Homes Sales Target in this particular example, what you could estimate to sell in that area with a 10 percent market share over the next year, would be three or four homes.
Calculate Home Sales Target as Your Market Share Increases
Most of what you are calculating is out of your control, except your Market Share (at least as you become more established in that market). So your goal should be to grow your market share year after year; it's how you gain ownership, increase your return on investment, and how you will ultimately sell more homes in that neighborhood.
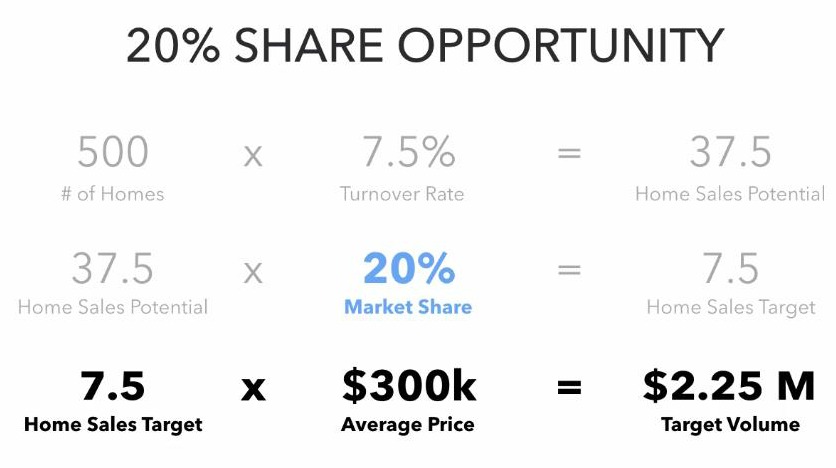
The only number you will change in this next calculation example is the Market Share percentage. Let's try with 20 percent (up from 10 percent in the previous example).
Home Sales Potential x Market Share = Home Sales Target
3.75 x 20% = 7.5
In other words, if you have 20 percent of the Market Share in this particular geographical region, you would sell approximately seven or eight homes per year.
Now calculate and document what this would be for your specific neighborhood.
Calculating Target Volume and Market Opportunity
As mentioned above, the only variable within your control is your Market Share, so that is how you calculate your potential Market Opportunity for the years ahead.
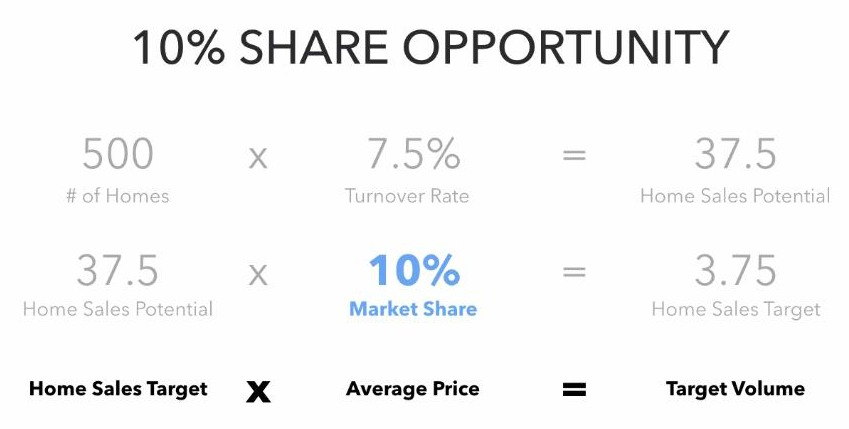
Take the Home Sales Target (based on your initial 10 percent market share) x Average Price = Target Volume
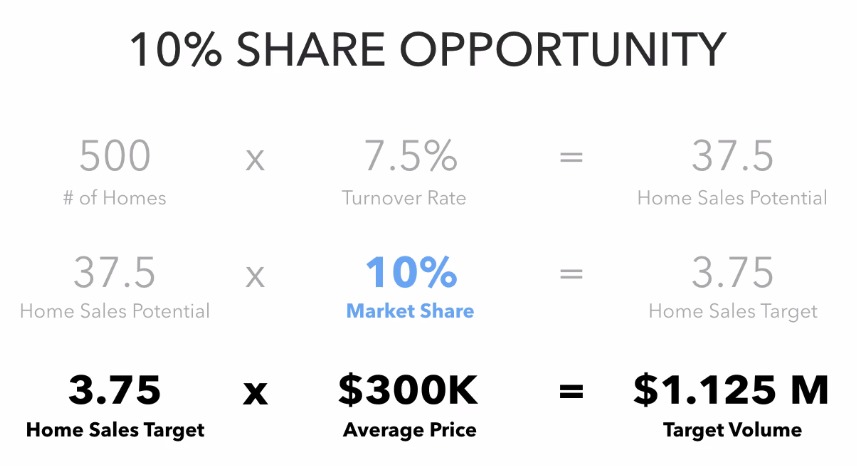
In that example, you are looking at a Target Volume of $1.125 million (annually).
What happens when you get to 20 percent market share? Let's see:
Consider what Market Ownership would look like at 60 percent of the Market Share of that neighborhood:
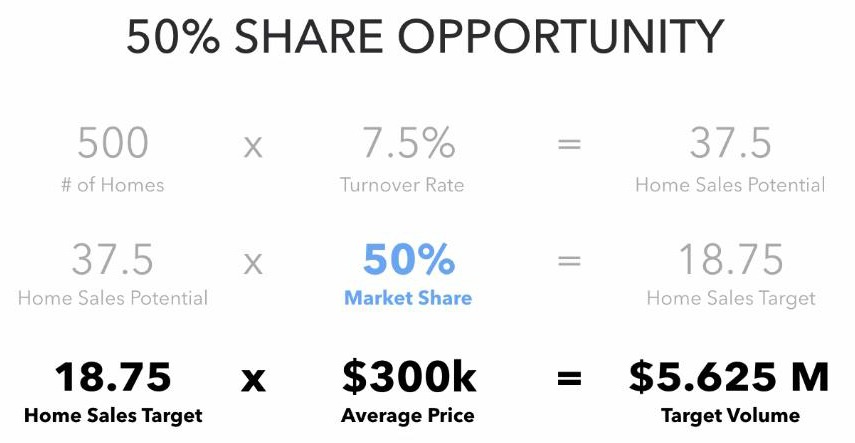
Of course, Market Ownership (40-60 percent) takes time to establish, but calculating the potential allows you to see the opportunity available of a particular market and is a good way to determine whether the neighborhood will be a good fit for you in the long term.
Will it yield enough volume to be sustainable?
Does the neighborhood hold enough potential to be worthy of your investment in time, energy, and money?
This is powerful, and your answers may require you to look at more than one market.
These numbers will also help you to set goals over the next year (and subsequent years) and should become a part of your annual planning process. Markets do ebb and flow, so recalculate each year and expect changes.
Other Variables that Affect Your Local Market Selection
There are three additional points to consider when selecting your local market:
Existing Market Share
If you are already working in a geographical market, make an assessment of your current market share in that area. Are you doing well? Play with the numbers and see what happens as your market share increases. Once you calculate that your area does have long term potential, set an intention to increase your Market Share in that neighborhood, and using the tools offered in our Paperless Agent Coaching Club, you are much more likely to reach your goals.
If you aren't doing so well in an existing market, by using the calculations above, you can now determine whether the situation is likely to improve or whether it's time to select a new market area.
Be honest.
Effects on Brand
Different price points, neighborhoods, and a variety of demographics (such as urban and suburban) will affect a brand. If you want to increase sales price, you will need to look at a different area (this is something beyond your control).
Don't continually work the same area if it isn't right for the brand that you're building in your real estate business. Ask yourself:
- What is the average sale price?
- What is the lifestyle like in that area?
- Does my brand support the image reflected in that area?
Don't go backwards! If you are building a brand and an area isn't in line with that brand you are building, even if it seems profitable, you may do your business a disservice in the long run.
Drive time
The time it takes to drive to your local market area really needs to be a factor that you consider for several reasons because it ultimately affects your sales cycle.
If it takes you an hour to drive to your market area, you will not get motivated to do all that is necessary to achieve Market Ownership of that area, including hosting an open house event on a Sunday or getting involved in the community. The closer you are to that area, the more present you will be in your market.
All of these factors need to be taken into consideration as you determine the Market Area you want to become known in.
This is the first step in becoming a Local Market Master – selecting the right market! It will take time to go through the calculations, but it will save you from making a costly mistake!
Enjoy this activity of possibilities!
To view the original article, visit the Paperless Agent blog.