
RETECHNOLOGY PREMIUM MARKETPLACE RELATED PRODUCTS | WEBINARS | SPECIAL OFFERS


You are viewing our site as an Agent, Switch Your View:
Agent | Broker Reset Filters to Default Back to ListLet's Get Graphic: How to Make an Infographic and MORE
May 02 2017
Infographics are unsung marketing heroes. They can be standalone content, supplemental for an article, or used as a visual aid in a presentation. We often reference infographics because they're easy to drag to our desktop, and looking at an infographic is a lot simpler and more time efficient than reading through an article.
The bottom line is that we see and use infographics all the time for both our personal and professional life. But why? Read ahead to find out why we're psychologically drawn to infographics and how to make them yourself for your business, social media, or marketing!
How to make an infographic. But first... why should you?
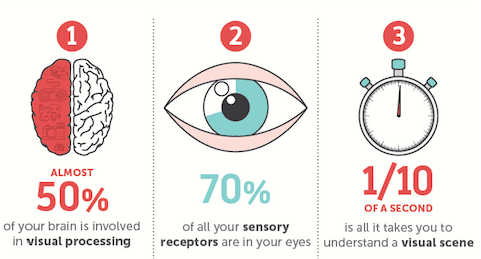
Why are people drawn to them?
Infographics can serve a variety of different purposes. Whether you're cranking them out for content on a site, or trying to learn something new, infographics can be your best friend. On average, people only remember 10 percent of information they hear three days later. However, when that information is paired with an infographic, people remember 65 percent of information three days later. Needless to say, infographics are a critical part in helping you and your viewers learn, retain, and apply information in the future.
If you're the viewer, infographics are an easy way to get a comprehensive summary of a topic without necessarily having to sift through a ton of words to get to the point. Especially if they're properly organized, infographics can provide an easy path to understanding a difficult concept or breaking things down in chronological order.
From a business perspective, however, infographics serve a different purpose. Infographics are shared three times more than any other type of content, so they help a company gain better brand exposure. By adding tags and including "share" buttons, they help improve your SEO (check out our article on how to use SEO to boost your website traffic) and enhance your internet presence. Needless to say, infographics can benefit everyone!
What Makes an Infographic "Good"?
Reliable Data
Infographics are most well-received when there is reliable data. In essence, an infographic acts as a visual snapshot of an article or post. You wouldn't provide your boss or readers with false statistics and information in a paper or blog post, would you? Hopefully not. The same thing goes for infographics. It should be reliable data to convince your audience that you're the expert in your topic.
Aesthetically Pleasing
Because it is a visual summary, it must be aesthetically pleasing. It should invite the audience to linger on the page and further engage with the website content. A simple color palette, the appropriate size, and not cluttering it with too much information will help will keep the audience visually engaged.
A Good Story
Infographics are a visual story and they should be used as such. Whether it's the story of how a company was founded or how to make your favorite mac and cheese, they should be adding value for your audience and fulfilling a need.
What Not to Do:
Create for the Sake of Creating
Similar to content on a blog or other site, don't create just because you want to put something on the website. Make sure that there is a compelling story to tell that your audience can benefit from.
Stay Away from Standard Templates
We know that creating a customized template takes some time, but we promise it's worth it in the end. Can you imagine seeing the same layout over and over again? It would be boring. So it's worth it to invest the time to create some custom templates for your website. It makes you unique, and differentiates your content from the many other infographics that are produced daily.
Want to Create?
There are plenty of online sites that allow you create your own infographics! Here are some options that will allow you to explore different features and accomplish different goals.
- Paid options: Business plan starts at $9.95/month
- What it's good for: A wide variety of templates, icons, and pictures. You can also upload your own image to be used in your infographic.
- Paid options: Pro accounts start at $15/month
- What it's good for: Can create your own template from scratch and change up the size to best fit your vision. You can also upload your own images
- Paid options: Can upgrade for $19/month
- What it's good for: Select templates to choose from with various ways to edit elements within the templates. Infogr.am is especially helpful for statistics or presenting other data.
The Big Picture
Whether you're looking to produce content or take in some information, an infographic is an excellent way to ensure that you're benefitting from the digital marketing frenzy. They're memorable, educational, and it doesn't take a graphic designer to create them. Now that you have all the tools to make an awesome infographic, find a story you want to tell and start creating!
Have any you want to share with us? Feel free to comment below!
To view the original article, visit the Contactually blog.