RETECHNOLOGY PREMIUM MARKETPLACE RELATED PRODUCTS | WEBINARS | SPECIAL OFFERS


You are viewing our site as a Broker, Switch Your View:
Agent | Broker Reset Filters to Default Back to ListShowingSuite Quick Tip: Use Your New Statistics Feature to Sell Your Listings Faster
August 12 2011
ShowingSuite is a popular tool among RE Technology's readers. We pulled this post from their blog to help the ShowingSuite users in our audience use this product more effectively.
With the most recent release, a new showing feedback statistics report view was included. What does this mean for you? A much easier way to track how your listing changes have affected your feedback responses!
One of our top feedback questions is “What did you think of the price?” When agents respond back, stating that the listing is overpriced, they are automatically asked to provide a dollar amount they believe the home is overpriced by. Showing Suite tallies those answers and averages the amounts the showing agents have indicated. The statistical report shows you not only that average, but it combines all of the showing feedback responses in an easy to read, graphical report.
What Do Your Showing Statistics Show?
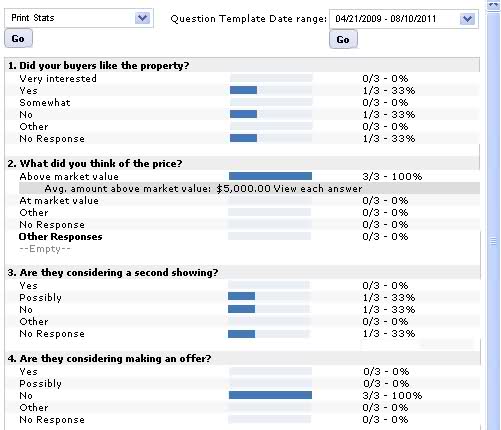 Feedback suggests this home is overpriced by about $5,000.
If you continue to get feedback that the listing is overpriced and there haven’t been many offers on the home, you and your sellers might decide to lower the asking price. But then what? How will you know if that made a difference?
With our new feature, you can reset your showing feedback questions and start a new statistical report!
Here’s how:
- Locate the listing for which you would like to change the feedback questions.
- Hover over the yellow Showing Actions button and select View/Edit Question Templates.
- Edit, Add or Delete questions as you see fit.
- When you are finished, all new showing feedback requests that are sent out will have the new question set.
Your new question set will have its own set of statistics. To view these, go to the Showing Actions menu and click View Statistical Report. You will see an option just above the graphical representation of the showing feedback responses, labeled Question Template Date Range.
After reducing the asking price and resetting the feedback questions, we now see that we may have 2 offers coming in!
Now, you can change that option to view the previous set of statistics or the current set of statistics. Every time you change the feedback question set, a new set of statistics begins.
You can then show your sellers how reducing the asking price has changed the feedback. Perhaps you can even make it better and get the house sold with another price reduction. It’s been proven – price reductions sell homes.
Even if you haven’t made any listing changes, but still want to change your feedback request questions, this feature, which is available in all of our paid plans, is a great way to see how the showing feedback you receive changes based on the questions that you ask.
How Do You Stack Up?
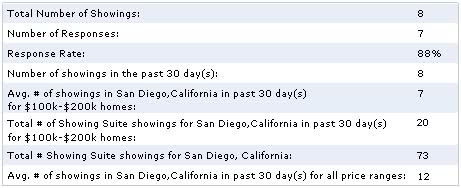
Another great feature we’ve built into our showing statistical report is the ability to view average showing statistics for the past 30 days.
Near the top of your statistical report, you will see exactly how your listing compares to others in your area. Quickly check your showing feedback response rate, total number of showings, and see how your listing stacks up to the competition.
Breakdowns by average number of showings in your listing’s area for all price ranges and for your listing’s price range for the past 30 days are shown here, so you can see exactly where you stand. Do you need to market your listing more? Reduce your price? Spruce up the landscaping? Or are you way ahead of the competition?
We strive to bring you the best tools we can think of to increase your sales and reduce your listings’ time on the market, and welcome your suggestions for improvement or feature enhancements!
If you have any questions about this feature or other features in your Showing Suite account, you can browse our Help Desk Knowledge-base or submit a Support Request by clicking the Help link at the upper right corner of your Showing Suite screen.