
RETECHNOLOGY PREMIUM MARKETPLACE RELATED PRODUCTS | WEBINARS | SPECIAL OFFERS


You are viewing our site as a Broker, Switch Your View:
Agent | Broker Reset Filters to Default Back to ListHeat Maps Use Color as the Universal Communicator
May 11 2015
 Words, and especially data, get lost in the shuffle of today's sweeping onslaught of information sharing. But color is a different story. Color deepens understanding, increases retention and sparks engagement. In fact, color can increase readers' attention span by 80 percent and comprehension by as much as 73 percent.
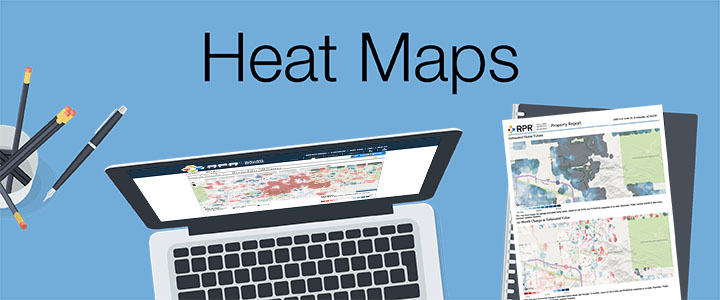
What's more welcome about color is its adaptability to innovation. When coupled with technology, color can be used to transform complex data into a digestible, relatable and, most importantly for REALTORS®, decision-making context. Such is the case with RPR heat maps, one of the most creative and powerful technological innovations in the history of visual marketing.
For REALTORS®, heat maps unearth current market trends and historical data from up to 11 different data sets and compile them into one striking, color-coded visualization—each layer a graphical representation of a geography's home values, average sales price, flood zones, square foot values, distressed properties, and more. All presented in a way that prospects and clients understand quickly, clearly and with greater interest.
 John Virden, a REALTOR® with Keller Williams Memorial Realty based in Houston, experienced first-hand how positively prospective clients react to RPR's heat maps.
"I needed to stand in for a colleague at an open house, in an unfamiliar area, so decided to use RPR heat maps to find out 'what's hot and what's not' in the neighborhood," said John. "I showed the heat map to one of the open house guests. She was so impressed, she called the next day to request a heat map of her neighborhood, and I ended up listing her house."
John recalls the guest's reaction to the heat maps: "You know, I get tons of flyers and postcards in my mailbox from REALTORS® but have never seen anything like this!"
Like John, REALTORS® across the country are adding heat maps to their custom property reports, fully optimizing the opportunity to reach clients in ways they find appealing, relevant and results oriented. "I encourage REALTORS® to use the heat maps in listing presentations and remind them to expand the map to reach specific neighborhoods," he said.
Create a visual experience for your client similar to the animated heat map seen below. Then build your heat map at narrpr.com.
Quick Heat-Map Building Tips:
Enter an address or zip code in RPR search. From the results page, choose "heat map" on the drop down menu located under the map. For a larger map, select "bigger map" or "map view" which will display the 11 data-set options. To include a heat map in your Property Report, select "map layers" from the available options.
Sources: Loyola College, Maryland, USA; Case & Company Management Consultants; Bureau of Advertising, Color in Newspaper Advertising; Maritz Motivation, Inc. Southern Illinois
To view the original article, visit the RPR blog.